

by Mike Maharrey, Gold Seek:
Just last week, gold finally broke a “real” record that’s been in place since 1980.
“Now, wait a minute,” you might be thinking. “I’ve been hearing about new record gold prices since last spring. What in the world are you talking about?”
Well, you’re right. In nominal dollar terms, gold has been breaking records seemingly week after week for months. However, when you adjust the price of gold for price inflation, it was more expensive once in history – back in January 1980.
That record has finally tumbled.
TRUTH LIVES on at https://sgtreport.tv/
When we talk about the “real” price of an asset, we’re simply referring to the price adjusted for price inflation as measured by the CPI.
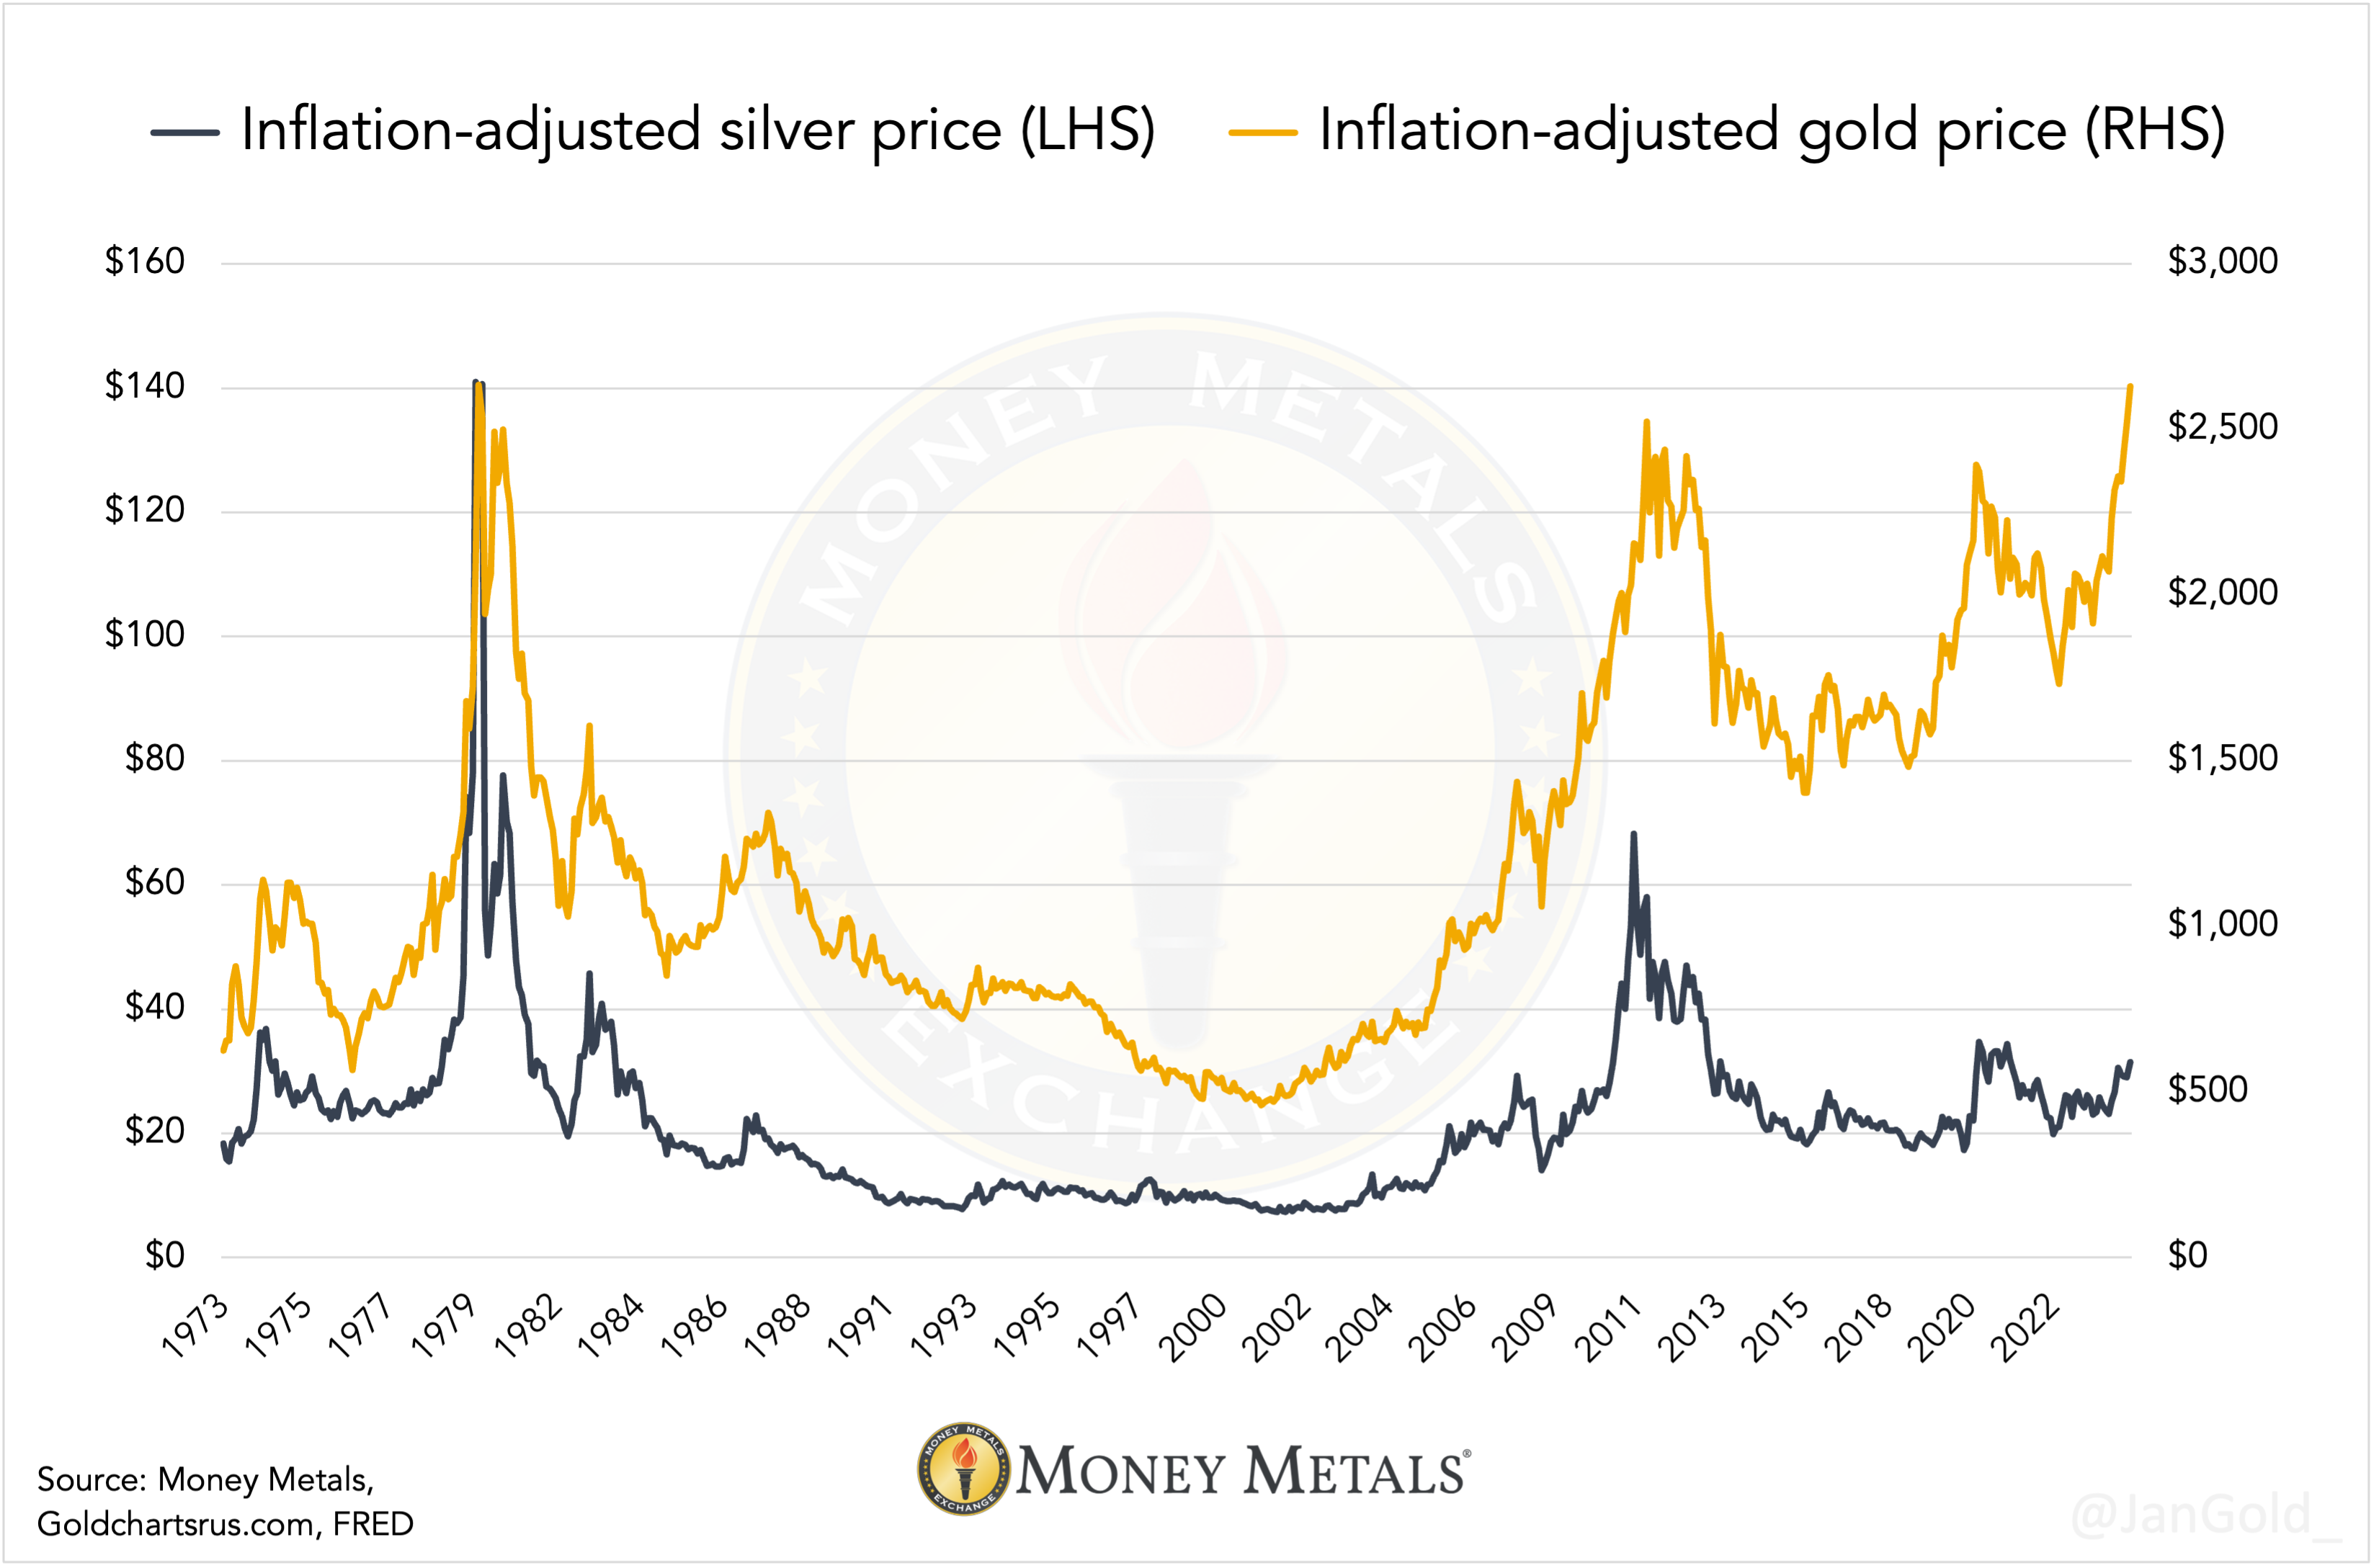
As price inflation peaked in the late 1970s, the price of gold spiked to $850 an ounce. In 2024 inflation-adjusted dollars, gold was around $2,689 per ounce at its 1980 high.
As I type this, gold is over $2,700!
Gold didn’t stay at that 1980 record level for very long. At the time Federal Reserve Chairman Paul Volcker was aggressively raising interest rates to battle price inflation. In February 1980, the Fed pushed interest rates to 15 percent and in March drove them all the way up to 20 percent. (This is what a real inflation fight looks like.)
Gold quickly fell off the January 1980 high. By the end of the year, it was back below $600 an ounce in nominal terms and it continued to trend downward for several years as Volcker’s inflation fight bore fruit.
Gold approached its real (inflation-adjusted) record high again in 2011 in the aftermath of the Great Recession and the Federal Reserve’s historic easy money policies in response to the downturn.
And here we are again.
An Extremely Bullish Chart
Interestingly, if you look closely at a chart of the real gold price, you will notice a very distinct cup and handle pattern. The twin highs in 1980 and 2011 form the cup’s two rims. After 2011, we see another shallower decline and the recent rally forming a handle.
This is a very bullish technical chart. Historically, the handle pattern precedes a significant breakout.
This cup-and-handle pattern has played out over an extremely long timeframe. Historically, longer patterns portend bigger breakouts with a broader base signaling a bigger upside case.
Gold’s nominal price followed a similar long-term pattern, resolving with a breakout to new all-time highs last year.
Yes, Gold Is and Has Been an Inflation Hedge
The fact that gold has traded below its 1980 real price high for decades doesn’t mean the yellow metal “hasn’t kept up with inflation,” as some people claim. That year was an anomaly. Through most periods, the price of gold has outpaced inflation as measured by the CPI and has served as an excellent inflation hedge.
In other words, if you bought gold virtually any time after 1980 and held it until today have been well ahead of inflation. And now, you’re on pace with price inflation even if you bought at the peak in 1980.
For instance, if you bought an ounce of gold in 2000, you paid around $285 an ounce – well below the 1980 high in both real and nominal terms. Since then, gold is up over 847 percent while the price inflation rate over that time comes in at around 81 percent.
Of course, the return on any investment depends on exactly when you buy and when you sell. If you happen to buy gold at the peak of a bull cycle and sell at the bottom of a bear run, you will likely lose money in both real and inflation-adjusted terms. There is always an inherent risk in investing. That means one can select arbitrary dates to “prove” that gold failed as an inflation hedge. That’s why one must always look at longer trends.