by Craig Hemke, Sprott Money:

For as long as anyone can remember, the most prominent driver of gold prices has not been inflation. That’s only half the picture. The actual driver has been inflation-adjusted or “real” interest rates. At least it used to be that way.
Suddenly, in early 2022, the correlation between real rates and gold prices broke down. And not just by a little. It broke down by a wide margin. At my TF Metals Report site, we’ve been discussing this “miscorrelation” for months but, recently, some mainstream media and analysts have begun to take notice. See this link from Bloomberg that appeared a few days ago: Chinese Gold Buying Is Driving a Paradigm Shift in Bullion.
TRUTH LIVES on at https://sgtreport.tv/
Analyzing the Correlation: Gold and Real Interest Rates
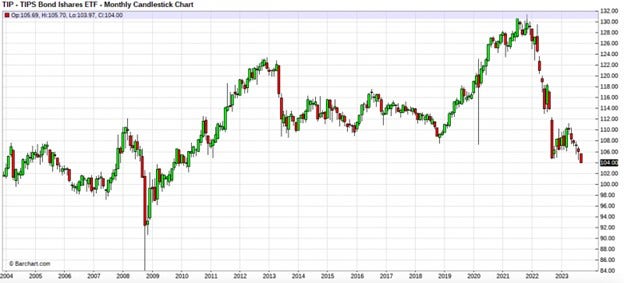
Let’s start with some charts. The easiest way to track inflation-adjusted U.S. interest rates in real time is by observing the share price of the “TIP” ETF. This ETF is loaded with Treasury Inflation-Protected Securities (TIPS) and its price moves inversely to real rates. As real rates fall and go negative, the share price rises. Conversely, as real rates move positive and rise, the share price falls.
Below is a 20-year monthly chart of the TIP ETF. Notice that, since the Great Financial Crisis of 2008-2009, the share price has largely risen as real rates fell. It peaked in 2022 and has since fallen sharply as rapidly rising nominal interest rates have turned the inflation-adjusted real rates sharply higher.

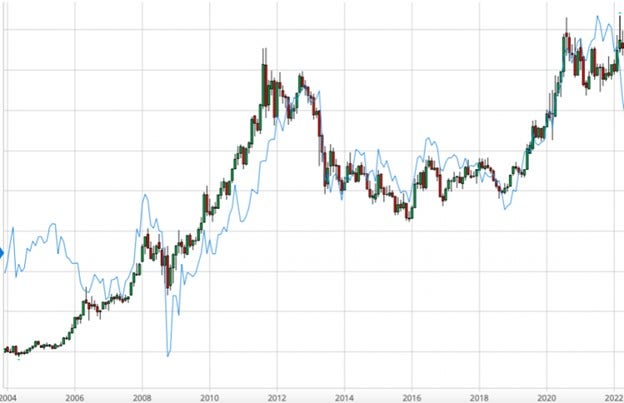
Next, if we plot the TIP ETF with COMEX gold prices you can see the extremely close correlation that held through early 2022. (The COMEX gold price is in candlesticks and the TIP price is displayed as a blue line.)

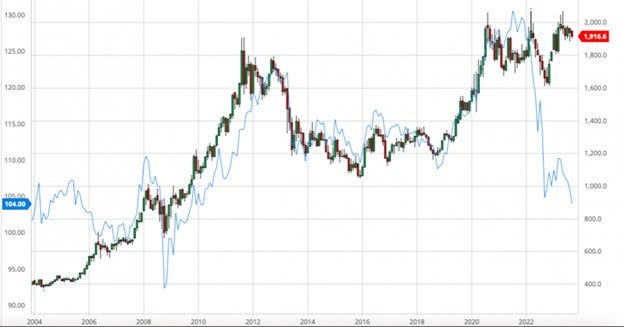
But look what happens when we add on the prices from early 2022 to present. Note the sharp divergence and “miscorrelation” below.

By the looks of that chart, you’d think that COMEX gold is massively overpriced relative to real interest rates. With real rates, as measured by the TIP, at 13-year highs (TIP price lows), you might have expected to see gold priced near $1000/ounce on COMEX. But it’s not. Instead, I have a last of about $1935/ounce, which is only about 6% off its all-time highs? What gives?
And that’s the question those Bloomberg writers, and many analysts on the internet, are twisting themselves into knots trying to answer! Why would this long-held and reliable correlation suddenly break?
A Historical Overview of the London Gold Pool
I have a different and easy-to-understand answer that you’re unlikely to hear from “mainstream” sources, and it begins with a history lesson.
Are you familiar with the London Gold Pool? If not, you should click that link and read all about how eight nations attempted to fix and manage the gold price from 1961-1968. At that time, the gold price was pegged to the U.S. dollar at a ratio of 35 dollars to one ounce of gold. In order to maintain the peg, the eight nations sold physical gold into the market whenever price exceeded $35 and then they bought it back when price fell below $35. This scheme worked great… until it didn’t.


