

by Peter Schiff, Schiff Gold:

This analysis focuses on gold and silver within the Comex/CME futures exchange. See the article What is the Comex? for more detail. The charts and tables below specifically analyze the physical stock/inventory data at the Comex to show the physical movement of metal into and out of Comex vaults.
Registered = Warrant assigned and can be used for Comex delivery, Eligible = No warrant attached – owner has not made it available for delivery.
TRUTH LIVES on at https://sgtreport.tv/
Current Trends
Gold
Gold is seeing its first increase in Registered inventory since April. That said, over December, there has been a mild net decrease in metal in Comex vaults of 100k ounces.
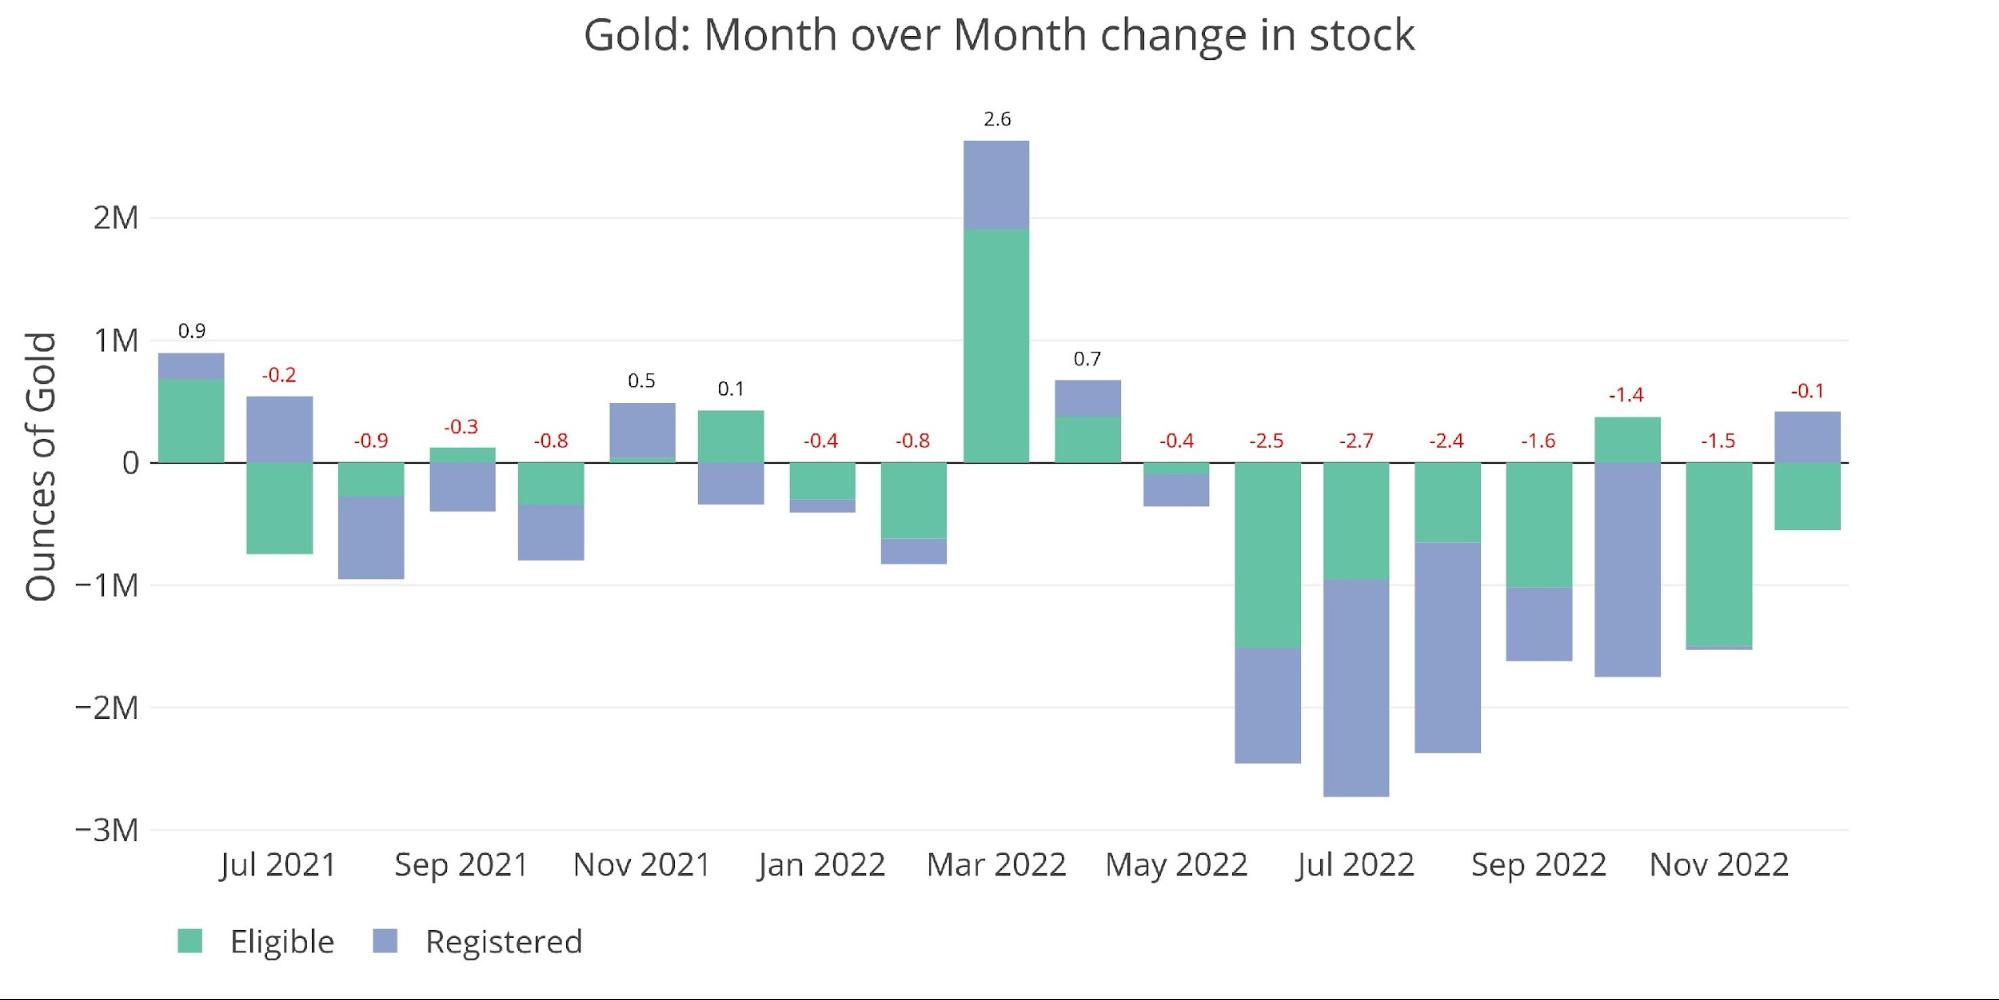
Figure: 1 Recent Monthly Stock Change
According to Comex reports, there are over 11M ounces of Gold in the Registered category. If so much metal is readily available for delivery, why are market participants moving metal from Eligible to Registered?
The short answer: there are not 11M ounces standing ready for delivery. Most of it is listed there for optics which was put in place shortly after the stress in the Comex system that occurred back in March 2020 (see Figure 8).
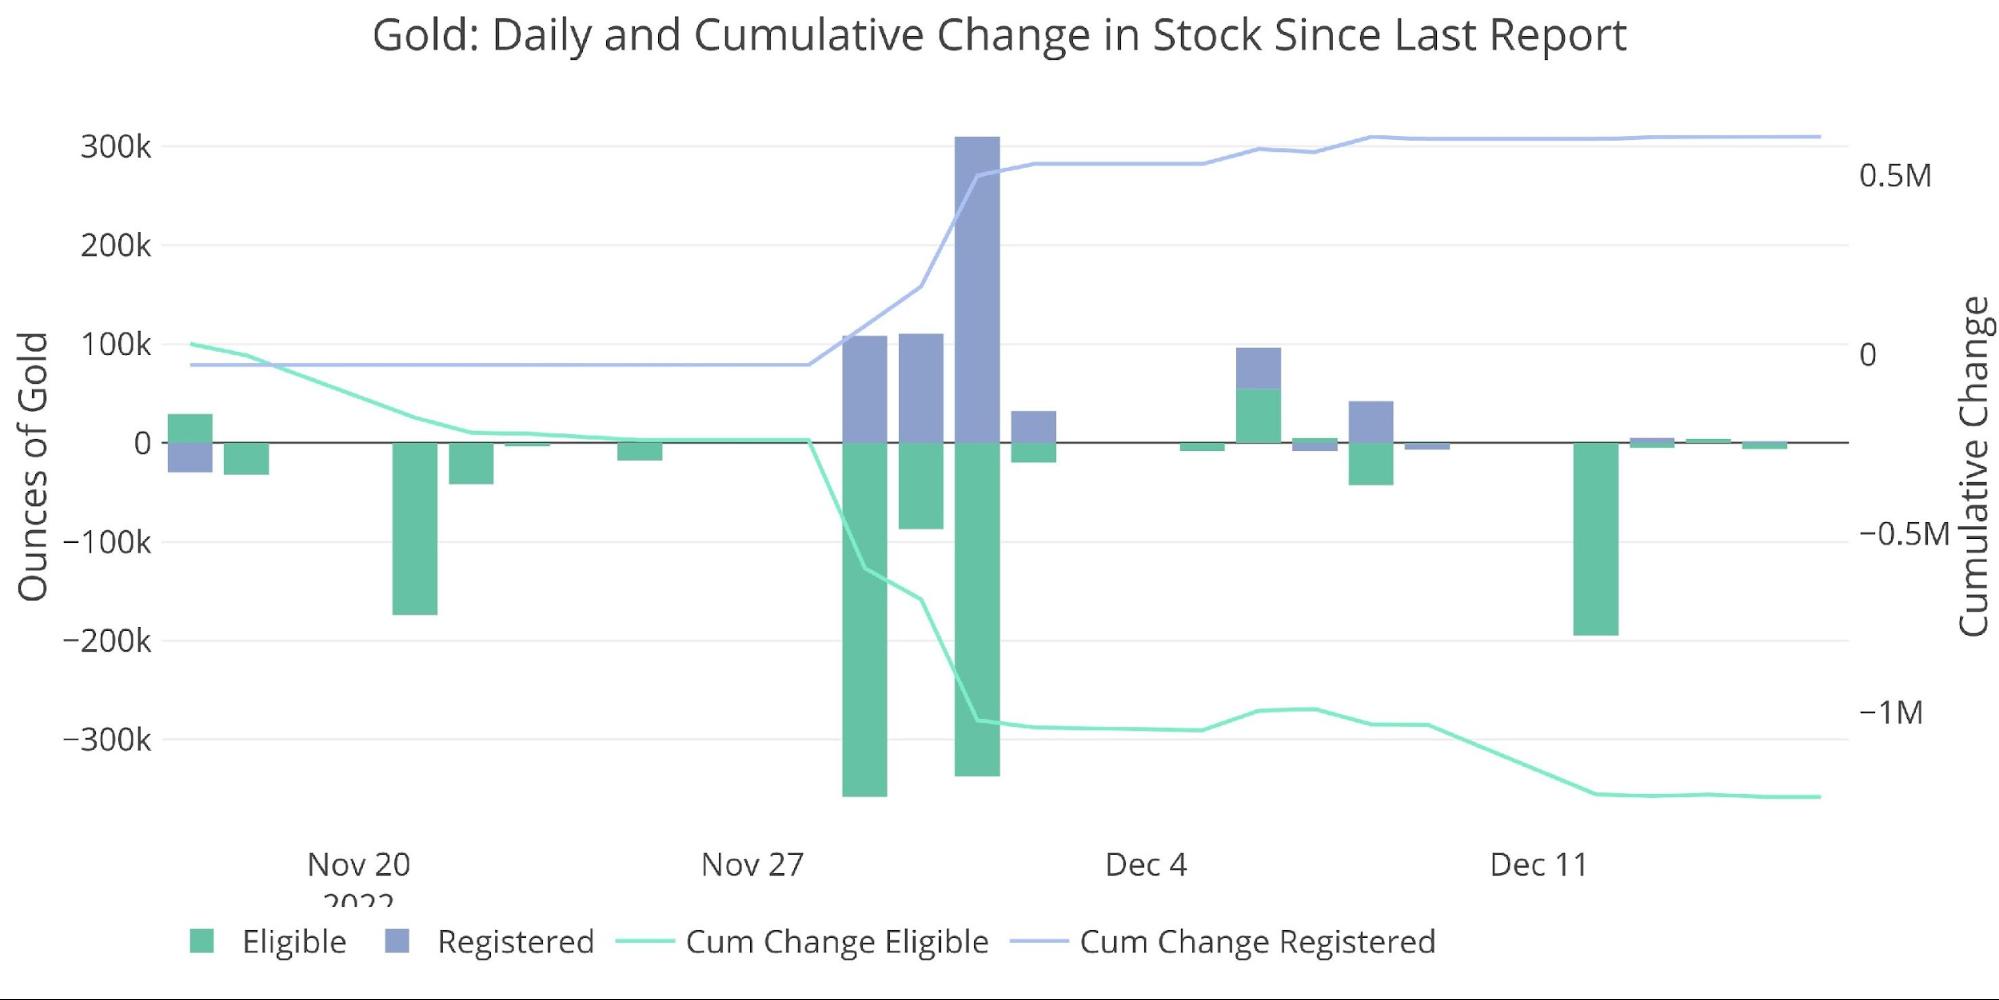
Figure: 2 Recent Monthly Stock Change
Since the start of the December contract, the amount Pledged has been steadily increasing again. Pledged is a subset of Registered but is actually not available for delivery because it has been pledged as collateral. This essentially inflates Registered by the amount shown below. Another tool to make the Registered category look bigger than it is.

Figure: 3 Gold Pledged Holdings
Silver
The supply of silver has been shrinking even more rapidly than gold. The drainage since the start of the year has been nothing short of spectacular. 48.5M ounces have left Registered since Jan 1. That represents more than 50% of the balance of 82M ounces last Dec 31.
After all this stress on the system, the Comex was only able to add a net 300k ounces of metal so far this month.
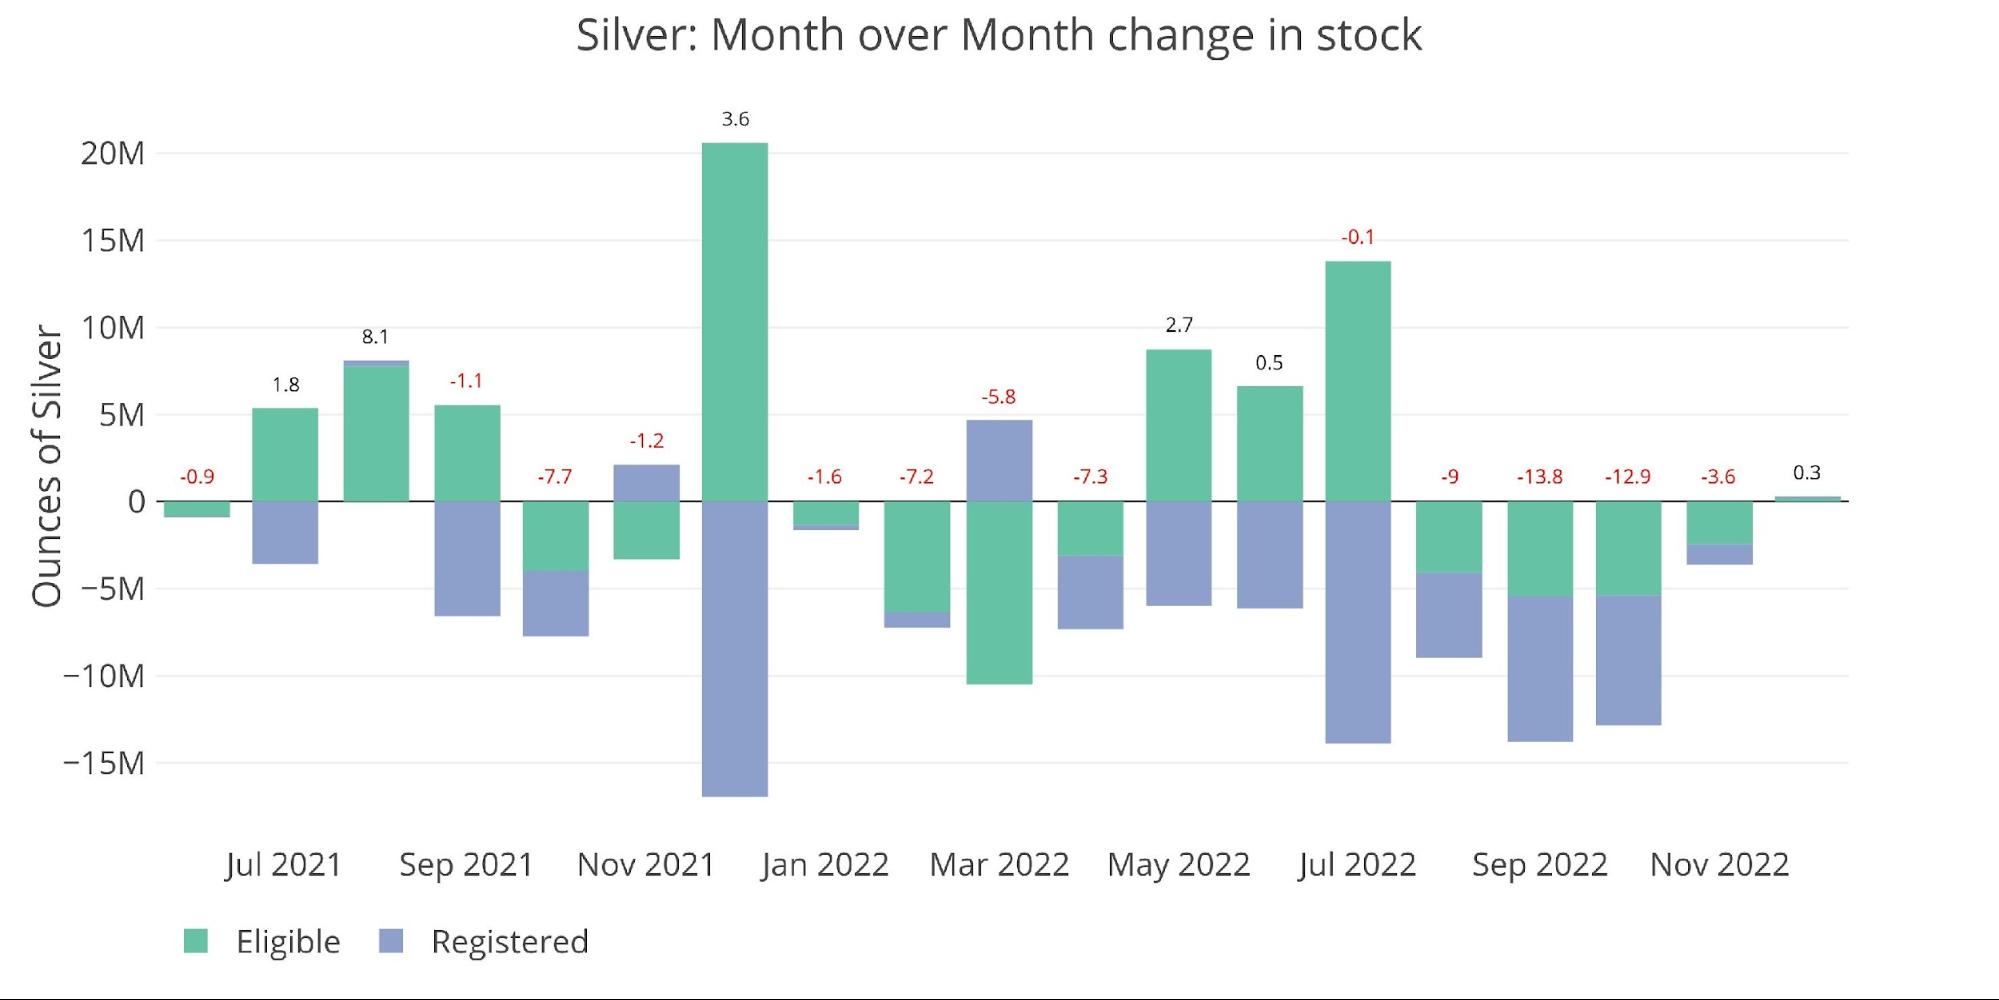
Figure: 4 Recent Monthly Stock Change
Much of the inflow came at the beginning of the month and has already been leaving since. It’s very likely that by the end of December, the net change in inventory is actually negative.
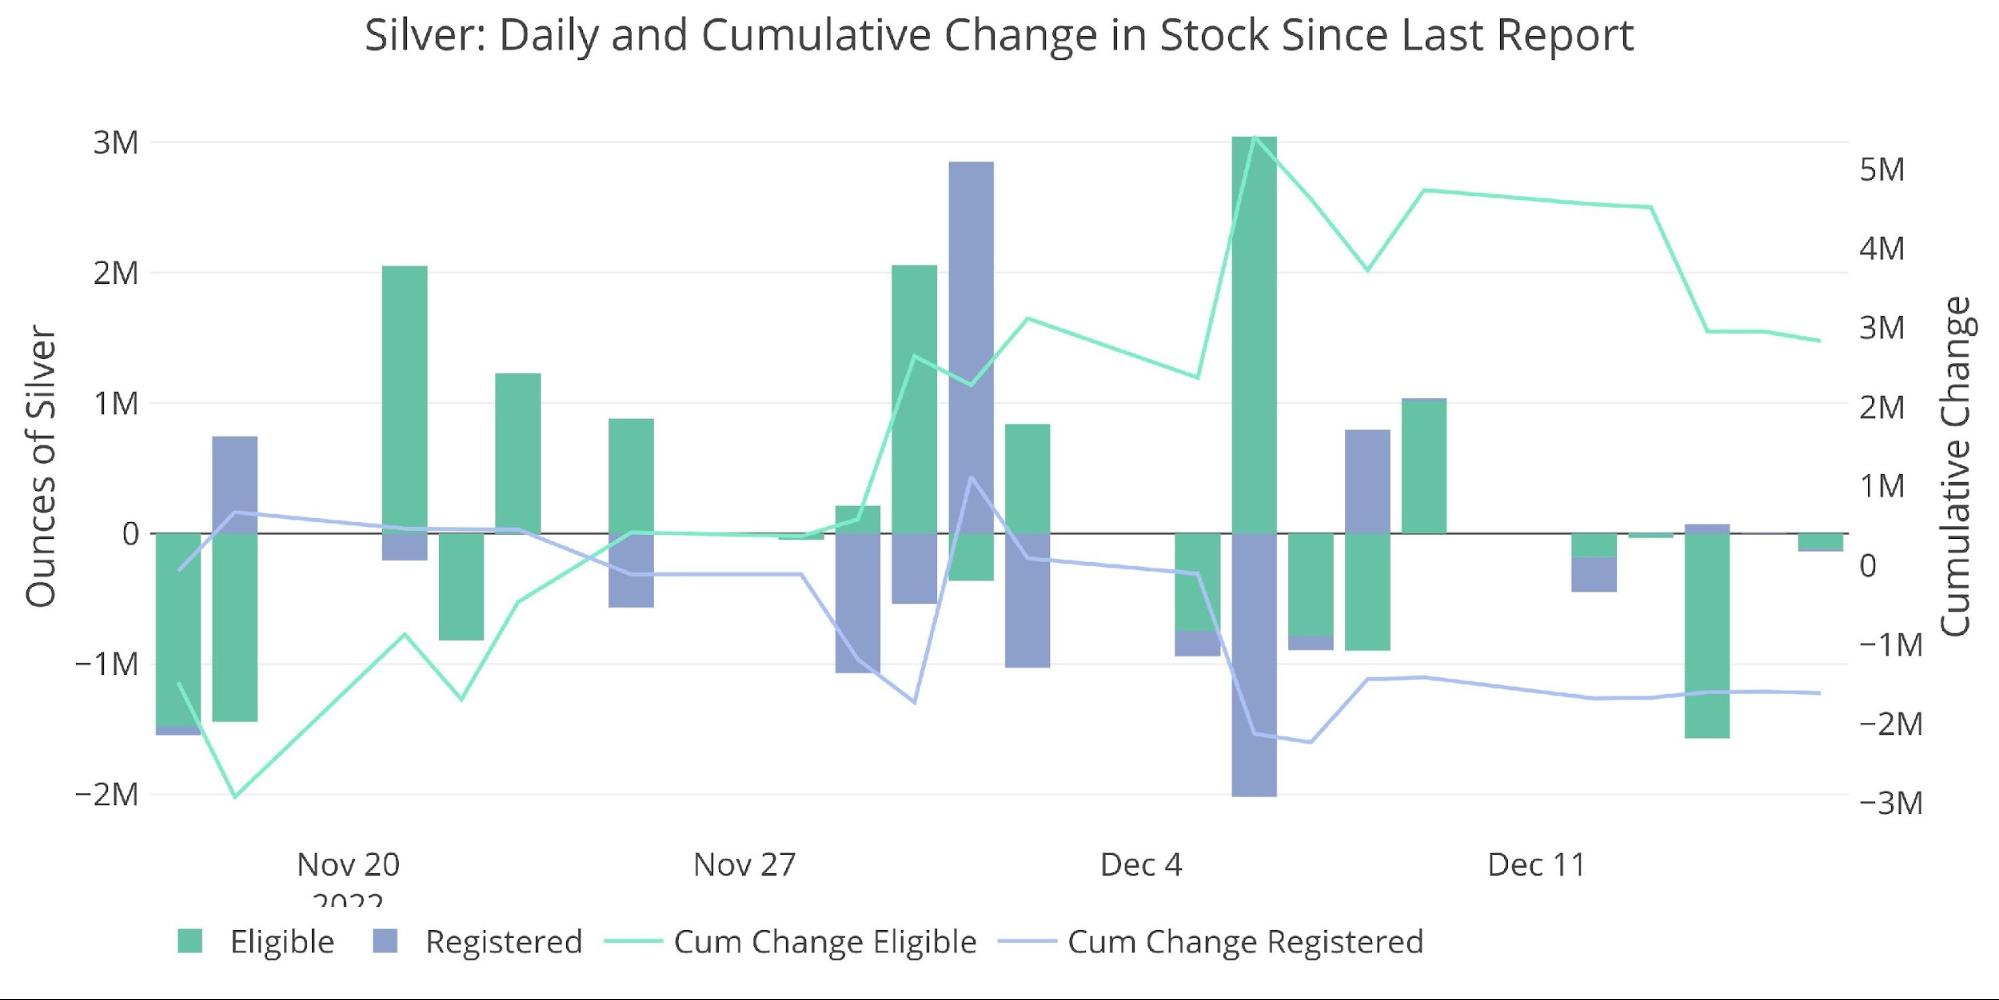
Figure: 5 Recent Monthly Stock Change
There is another major indication that shows inventory might be much smaller than is reported. As of yesterday, only 77.6% of contracts standing for delivery have actually had their metal delivered. Shorts are on the hook for deciding when to deliver the metal, so why are they dragging their feet? Through the 16th, this is the least amount of metal delivered as a percent of Open Interest on First Notice back to at least Jan 2020.
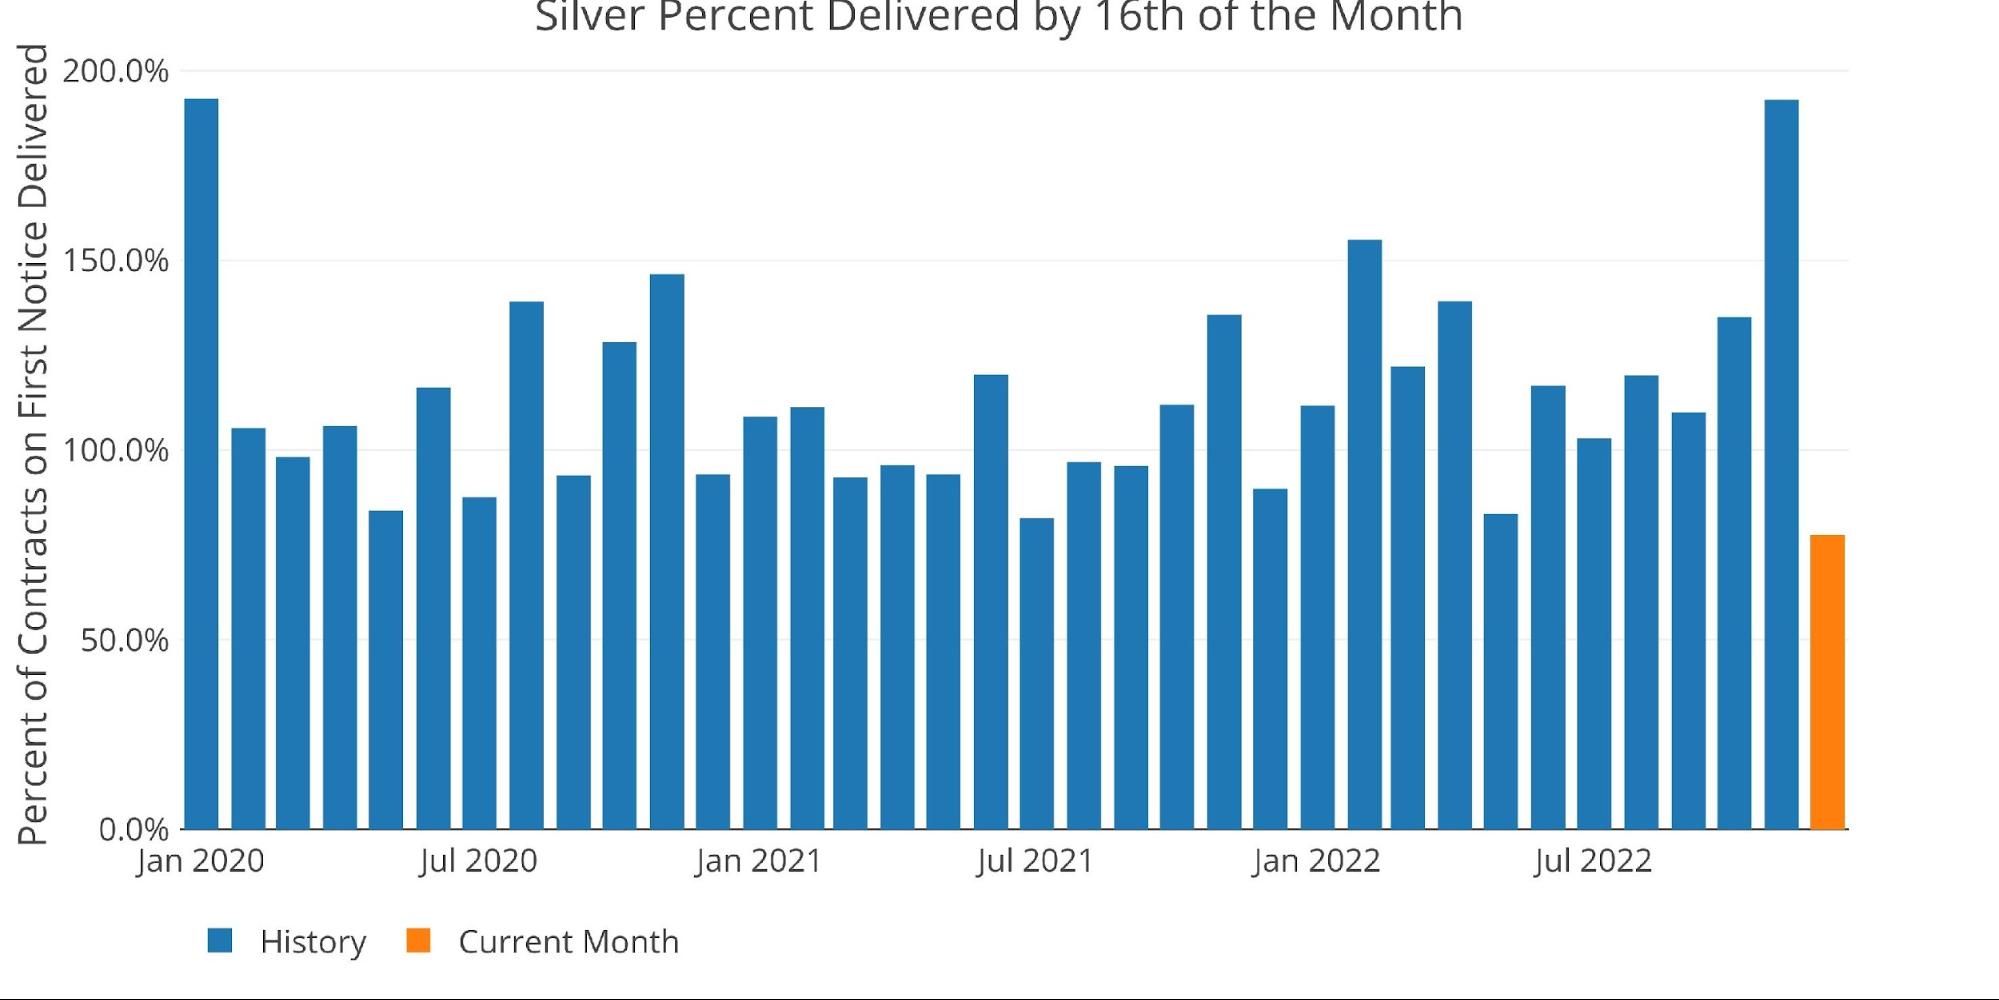
Figure: 6 Delivery Volume After First Notice
Another odd data point is the number of net new contracts after first position. There have been some months, like last July, where net new contracts are negative throughout the month. However, while this month is still positive, it went up and then reversed back down. This means that there are cash settlements happening way late in the contract.
Again, why? This does not usually happen!
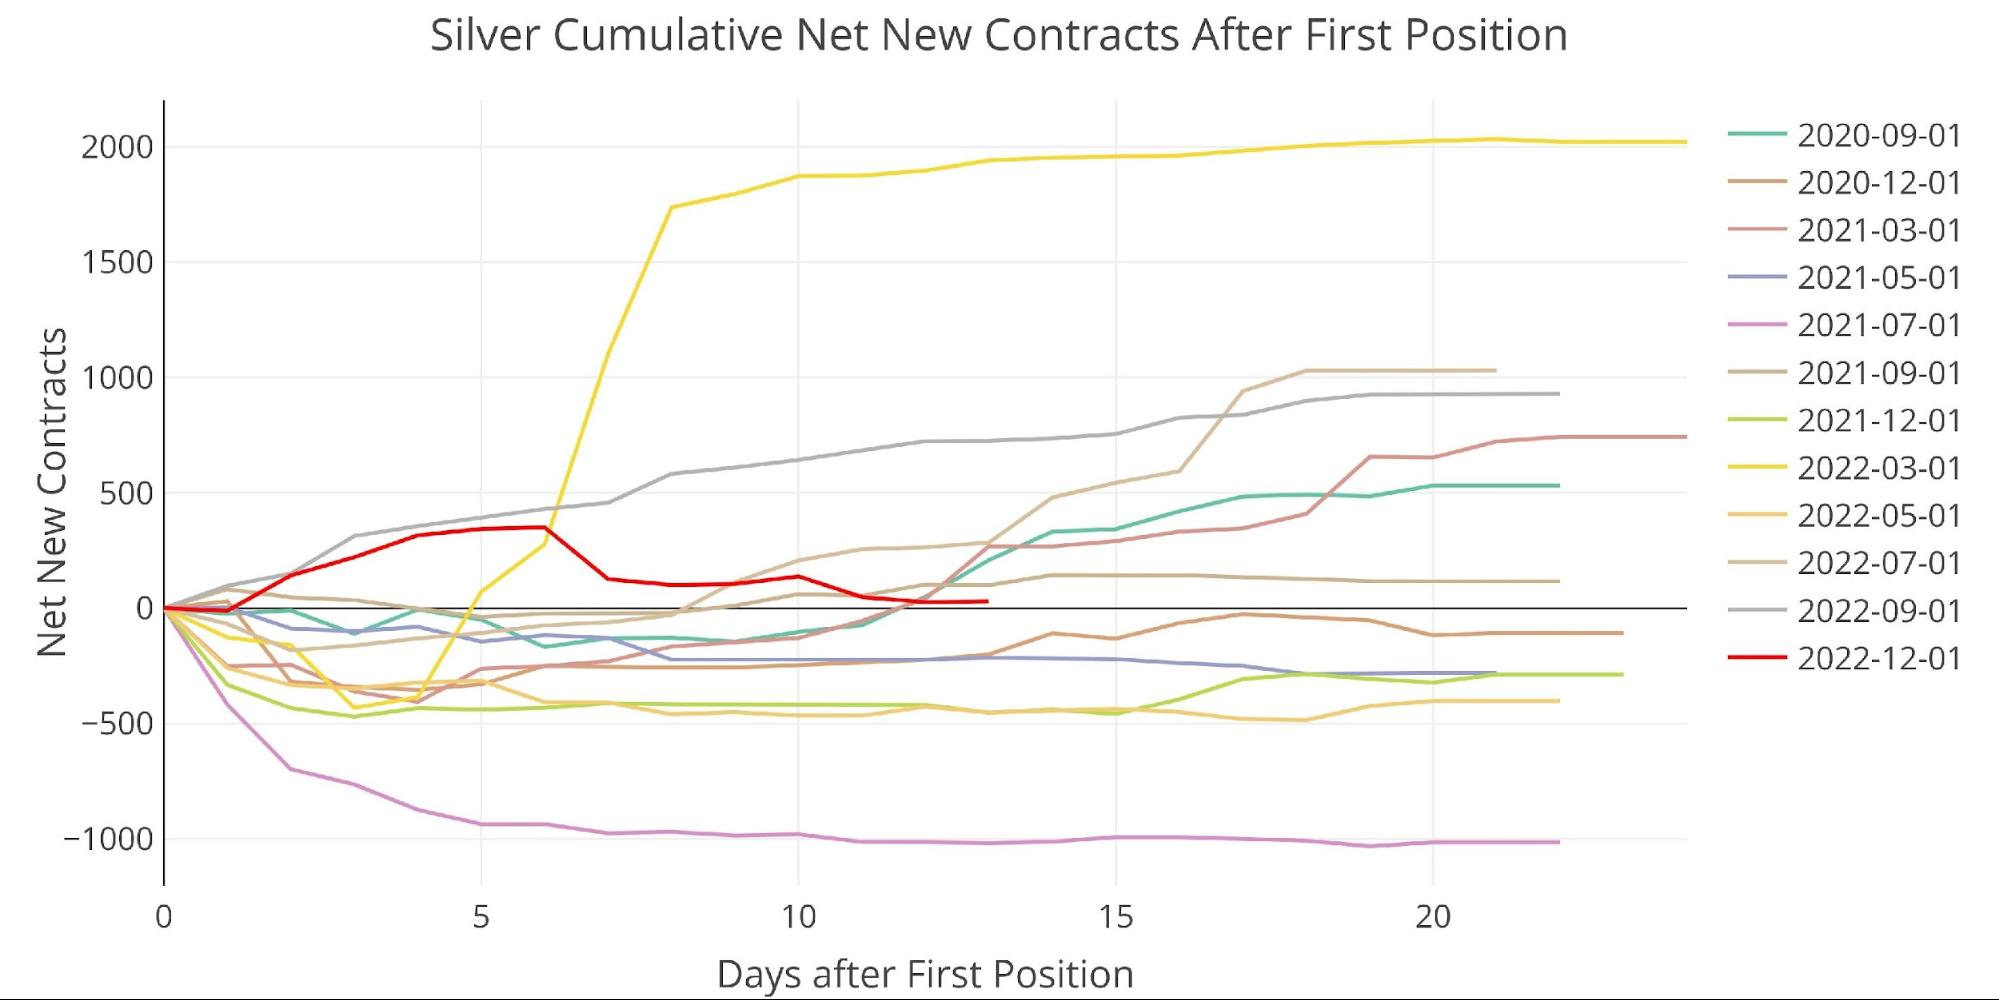
Figure: 7 Cumulative Net New Contracts
Let’s look back at the vaults. The table below summarizes the movement activity over several periods to better demonstrate the magnitude of the current move.
Gold
-
- Over the last month, gold has seen a net inventory decrease of 2.6%
-
- This is being driven by 1.2M ounces leaving Eligible vs only 608k ounces being added to Registered
-
- Since last year, the total amount removed exceeds 10M ounces of gold
- Over the last month, gold has seen a net inventory decrease of 2.6%
Silver
-
- Silver continues to see Registered supplies fall, with 1.6M ounces being removed over the last 30 days
- Eligible took a beating in the latest week, dropping almost 2M ounces
Palladium/Platinum
Palladium and platinum are much smaller markets but that may be where the market breaks first.
-
- Palladium saw a light increase as the delivery month got started
- Platinum inventory is down 12.1% over the last month as it prepares for the January delivery month
-
- It will not take many contracts standing for delivery to fully deplete Platinum from the vaults
-
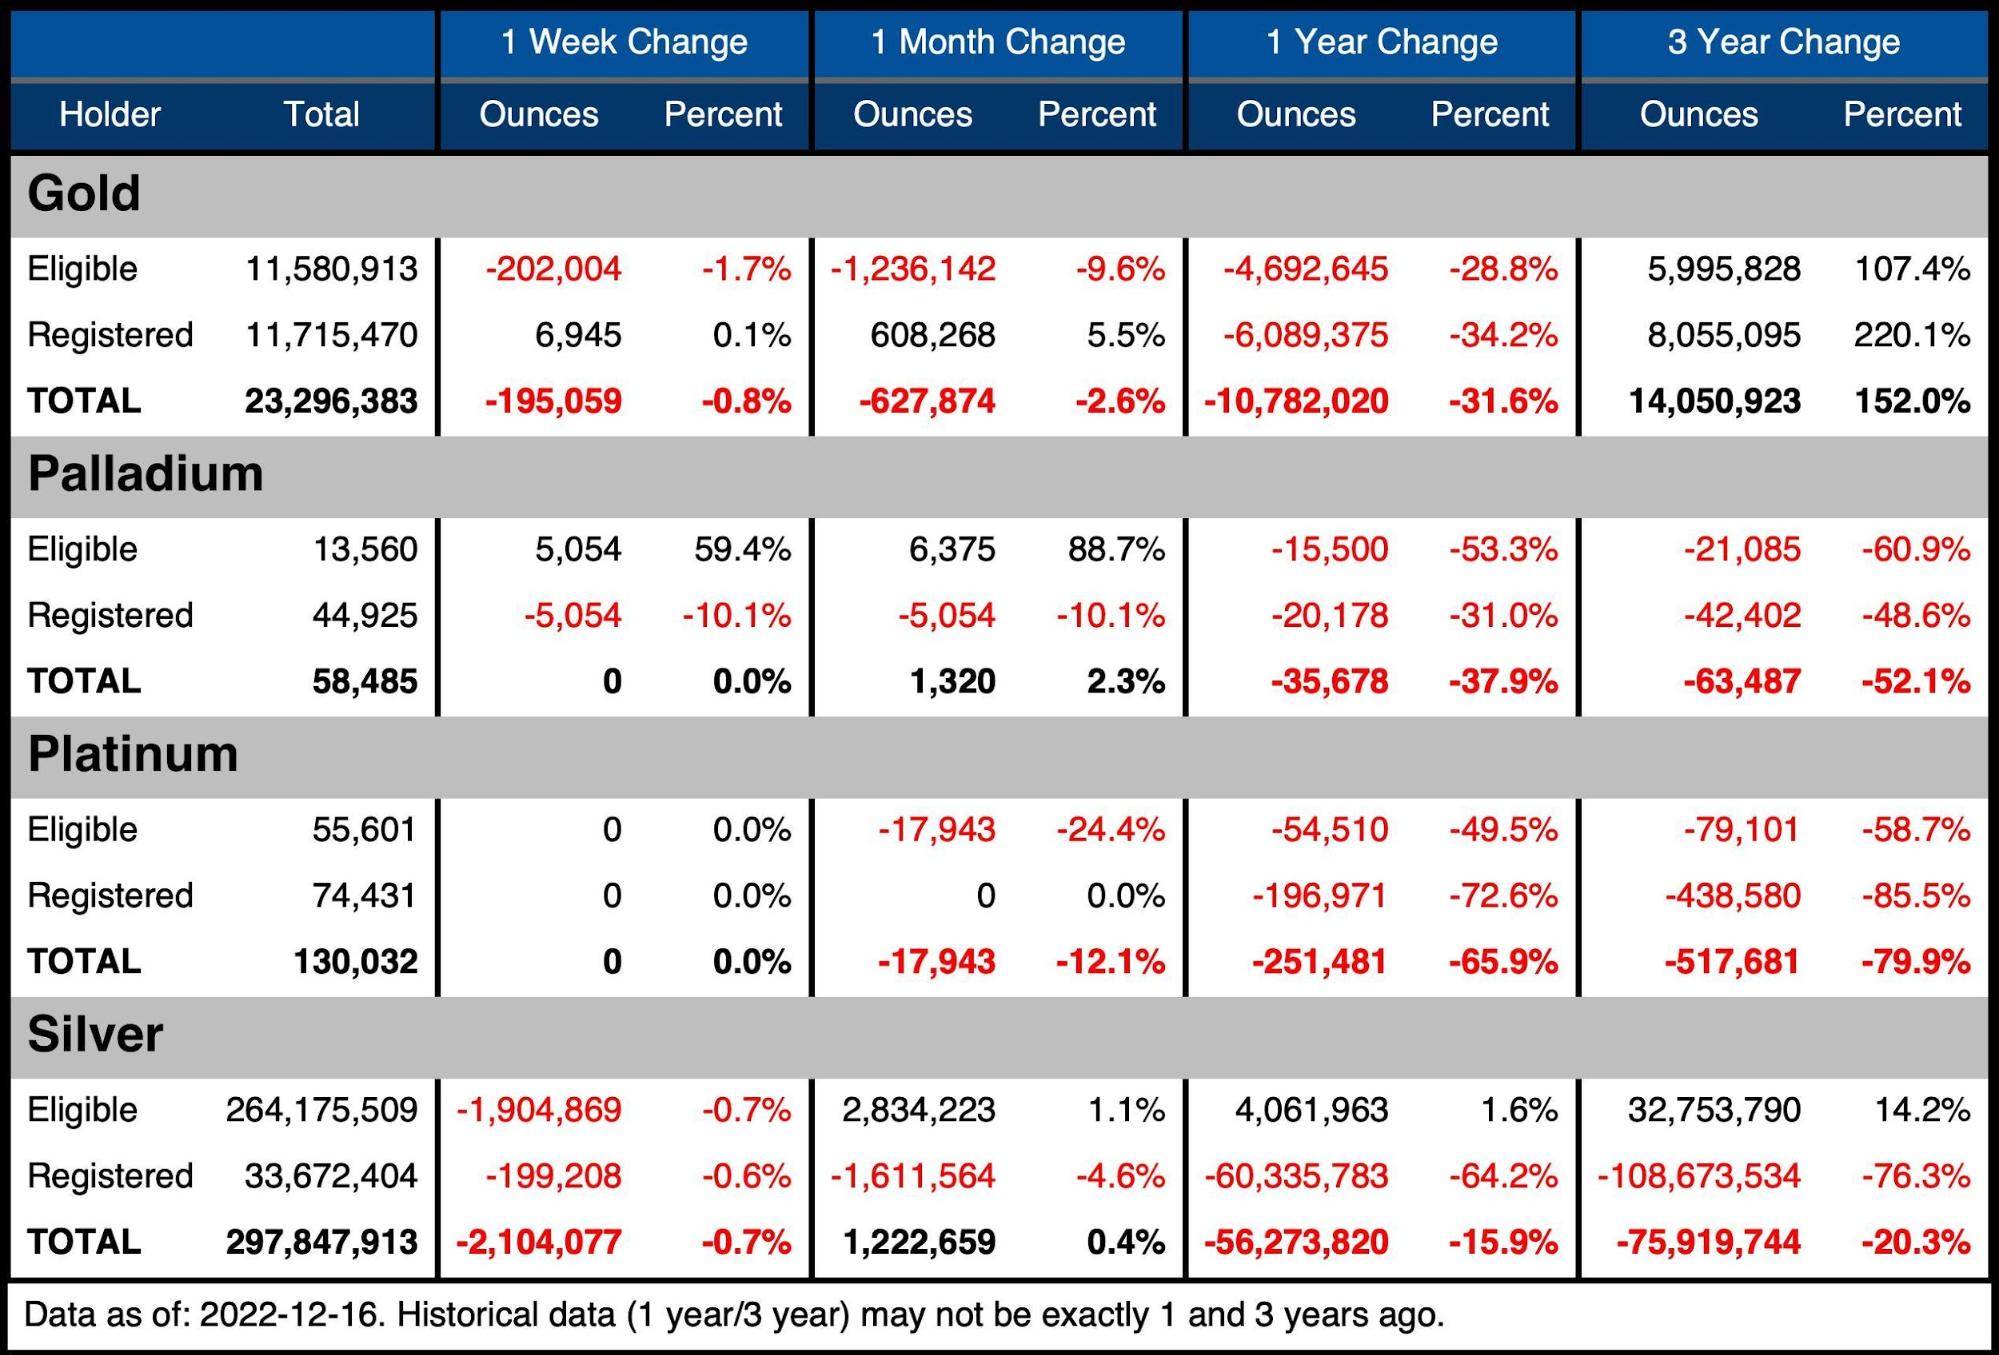
Figure: 8 Stock Change Summary
The next table shows the activity by bank/Holder. It details the numbers above to see the movement specific to vaults.
Gold
-
- The last month has seen net inventories fall across all vaults aside from a negligible increase in Manfra
- Brinks saw supplies fall by 7%
Silver
-
- Silver has seen some big moves over the last month:
-
- Manfra increased supplies by 4M ounces or 40%
- Delaware also saw supplies increase 2M ounces or 5%
- JP Morgan was on the other side, losing 3.8M ounces
- INT Delaware saw 264k ounces disappear which was 21%
-
- Silver has seen some big moves over the last month: