by Peter Schiff, Schiff Gold:

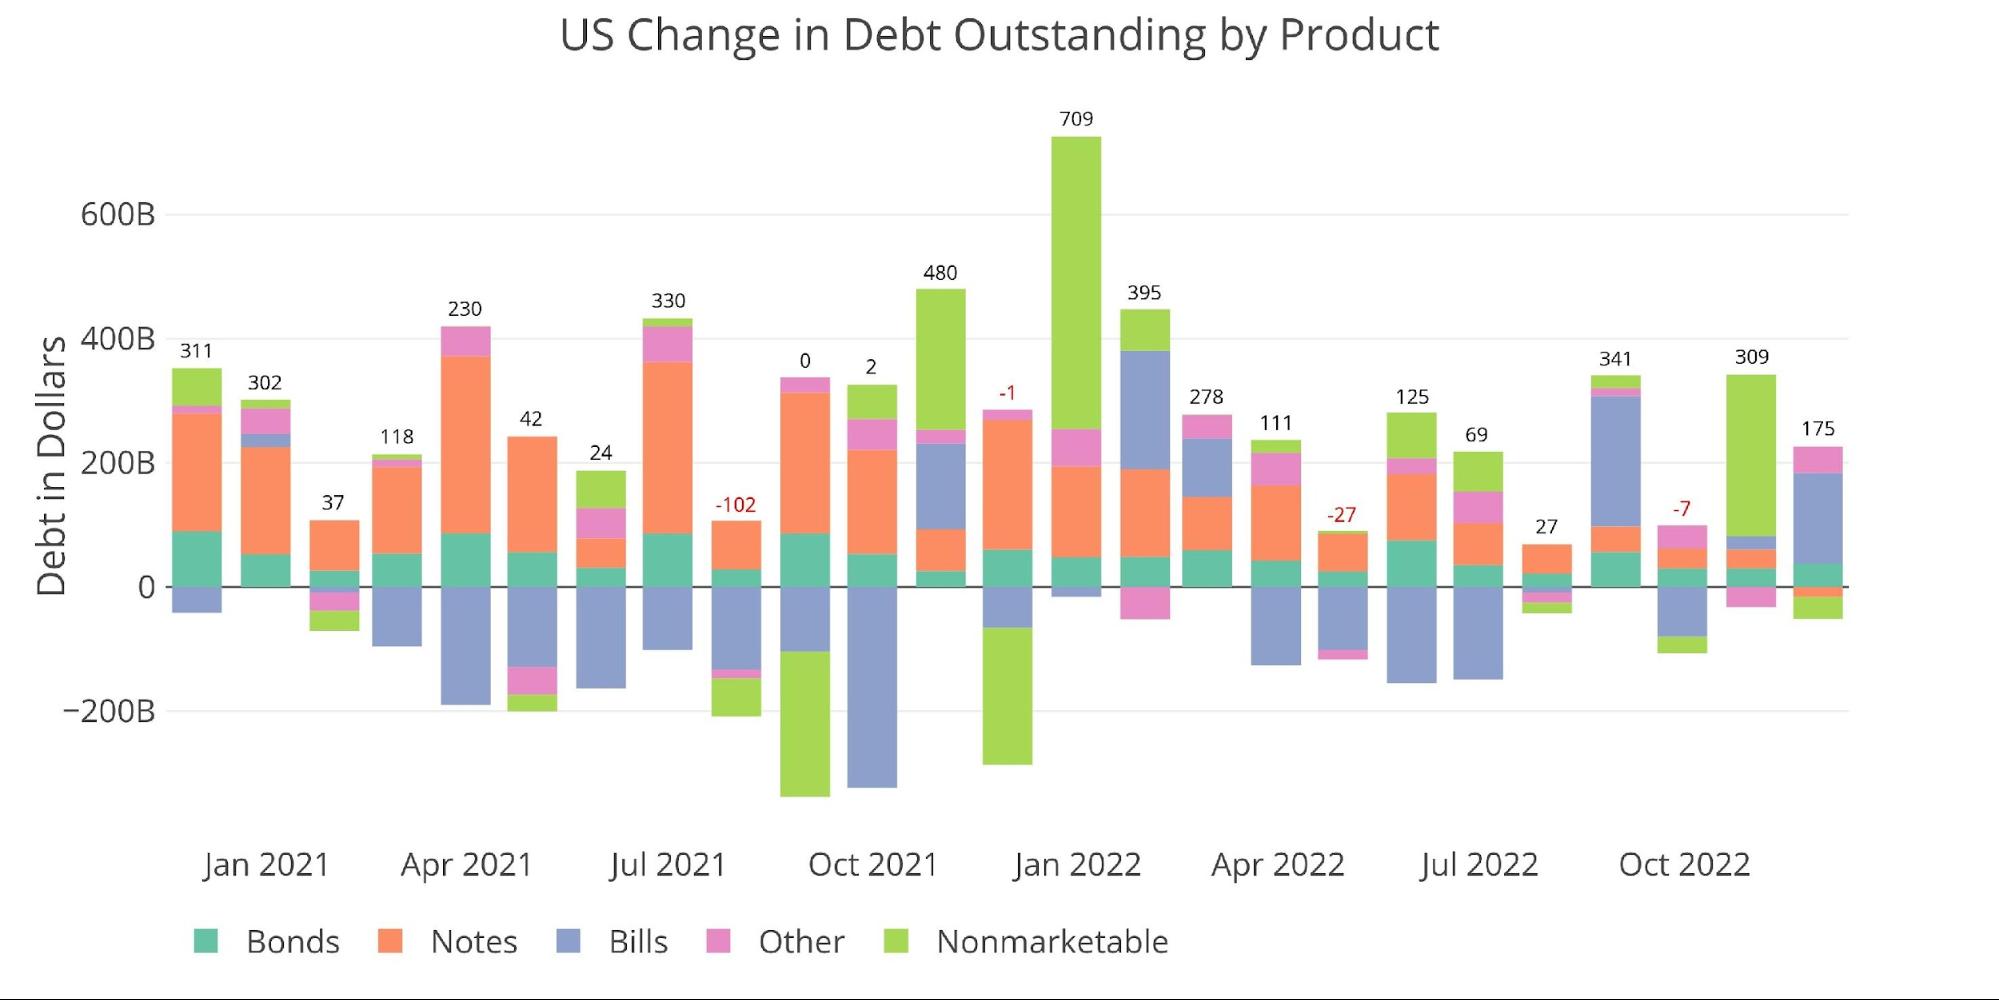
The Treasury added $175B in new debt during November, hitting the debt ceiling of $31.4T. New debt issuance was focused on the short end of the curve with $145B in Treasury Bills issued.
As is typically the case when the debt ceiling is hit, the Treasury starts pulling from Non-Marketable debt to cover additional expenses. They pulled $35B out of Non-Marketable, which is likely just a start. The last two debt ceilings saw Non-Marketable, specifically government employee retirement accounts, fall by over $220B.
TRUTH LIVES on at https://sgtreport.tv/
Note: Non-Marketable consists almost entirely of debt the government owes to itself (e.g., debt owed to Social Security or public retirement)
Figure: 1 Month Over Month change in Debt
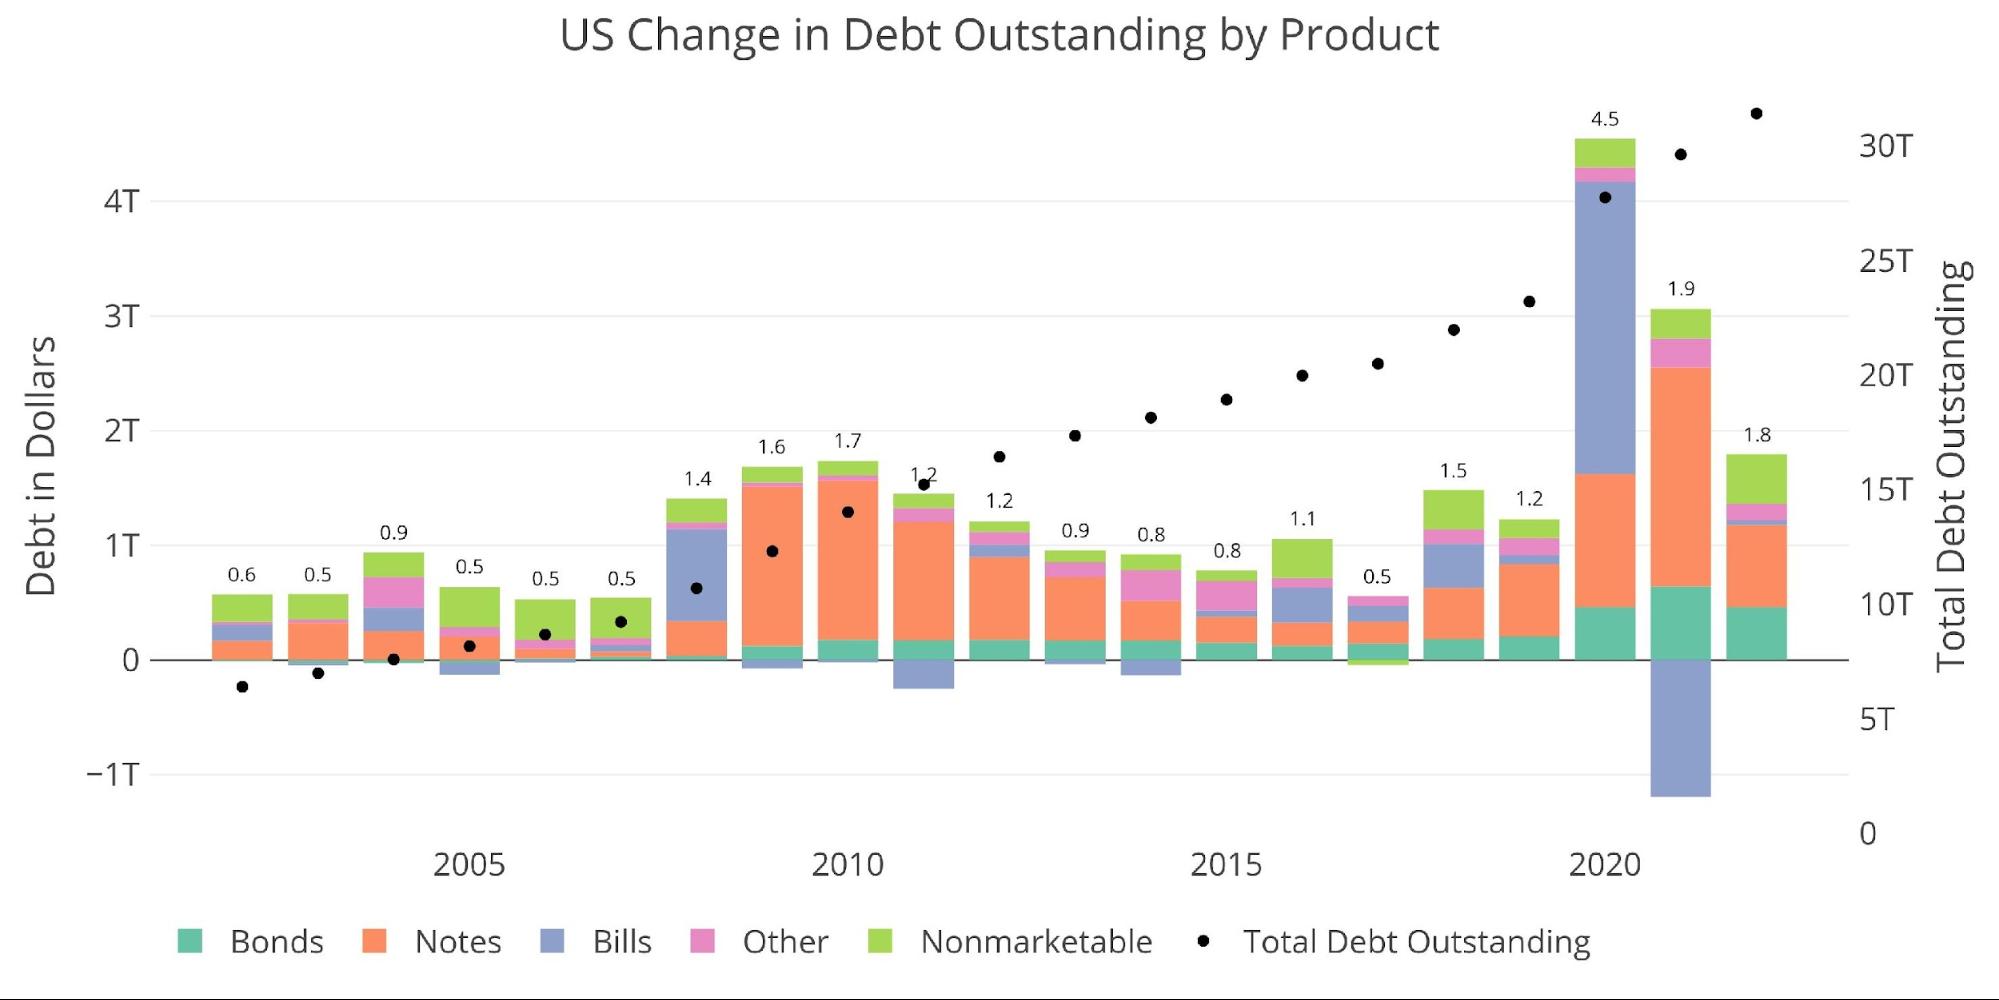
YTD the Treasury has added $1.8T in new debt in 2022 despite record-high tax revenues. With one month still to go, the total debt has already exceeded all other years before Covid.
Figure: 2 Year Over Year change in Debt
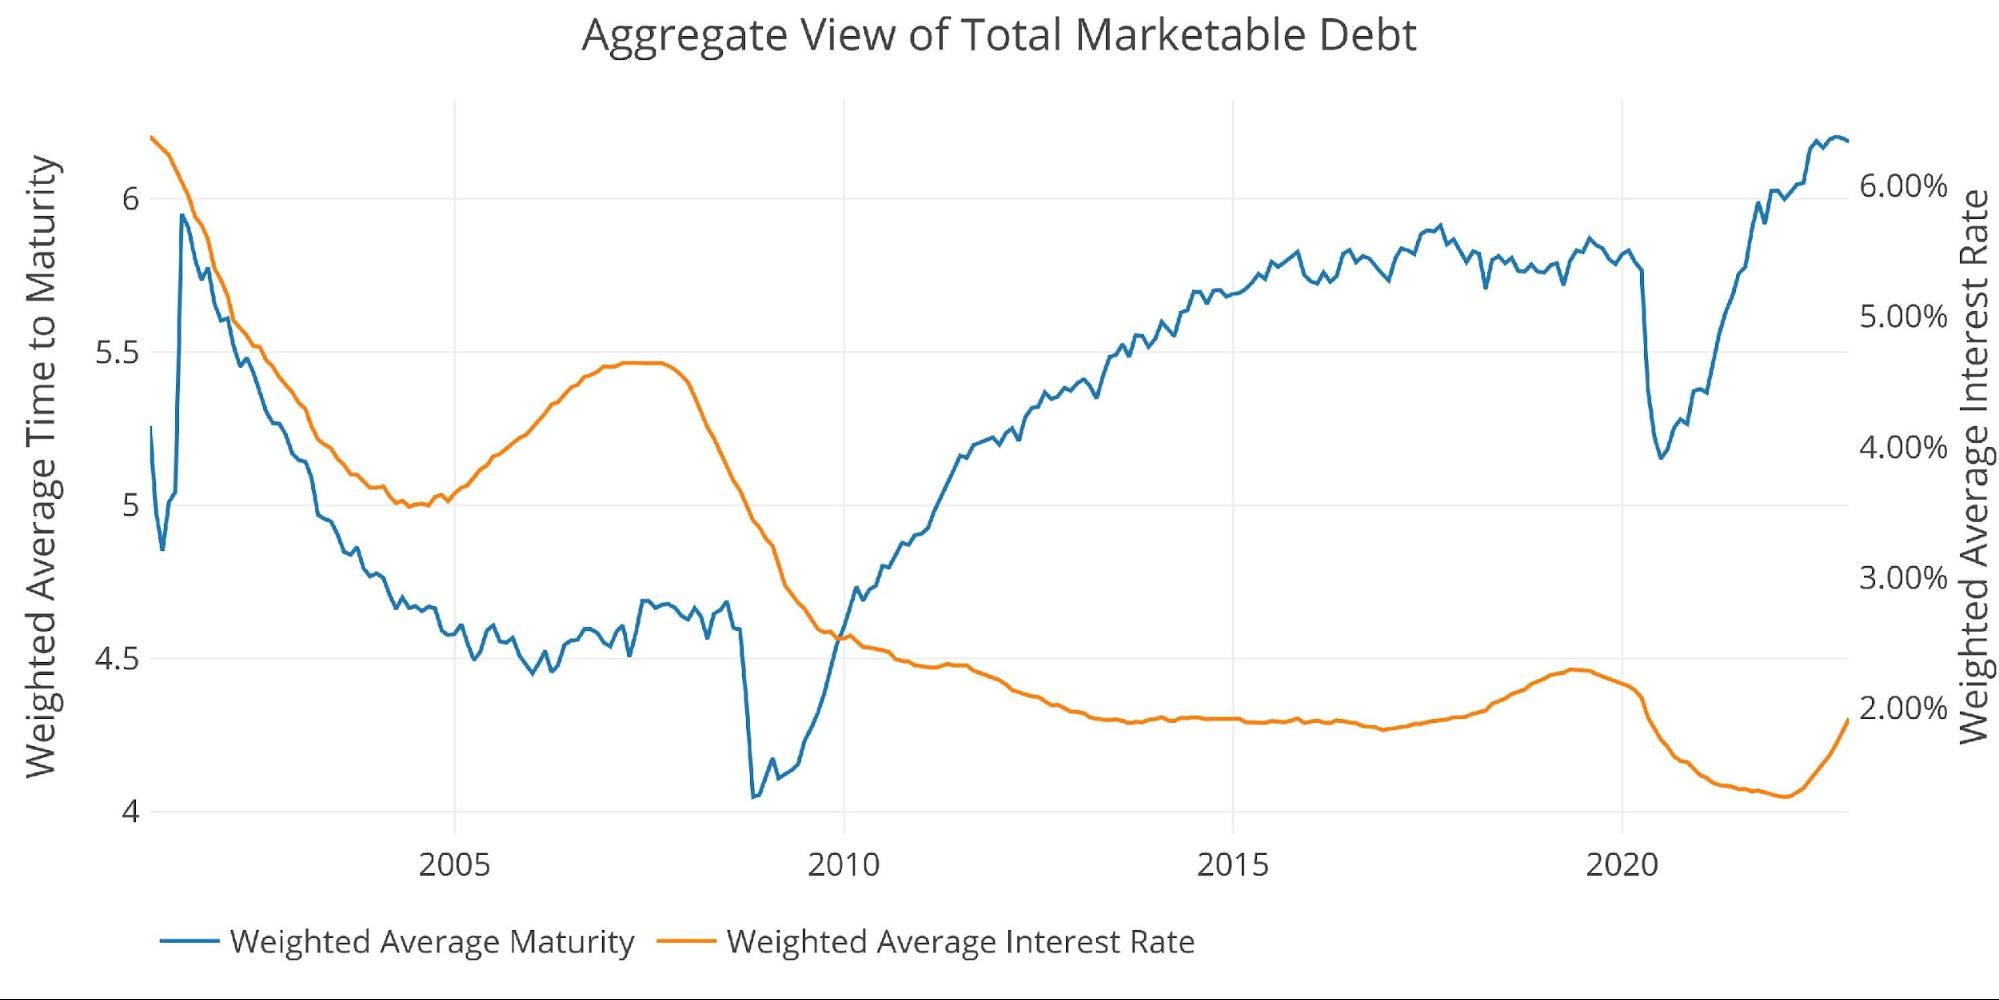
The chart below shows the impact of the current rise in interest rates, and the steps by the Treasury to prepare for such an event. Weighted average interest is at 1.92%, up 60bps from February of this year and 10bps from last month.
To try and extend the maturity of the curve, the Treasury did a massive conversion of short-term debt into long-term debt last year. That pushed the average maturity of the debt to 6.2 years.
Figure: 3 Weighted Averages
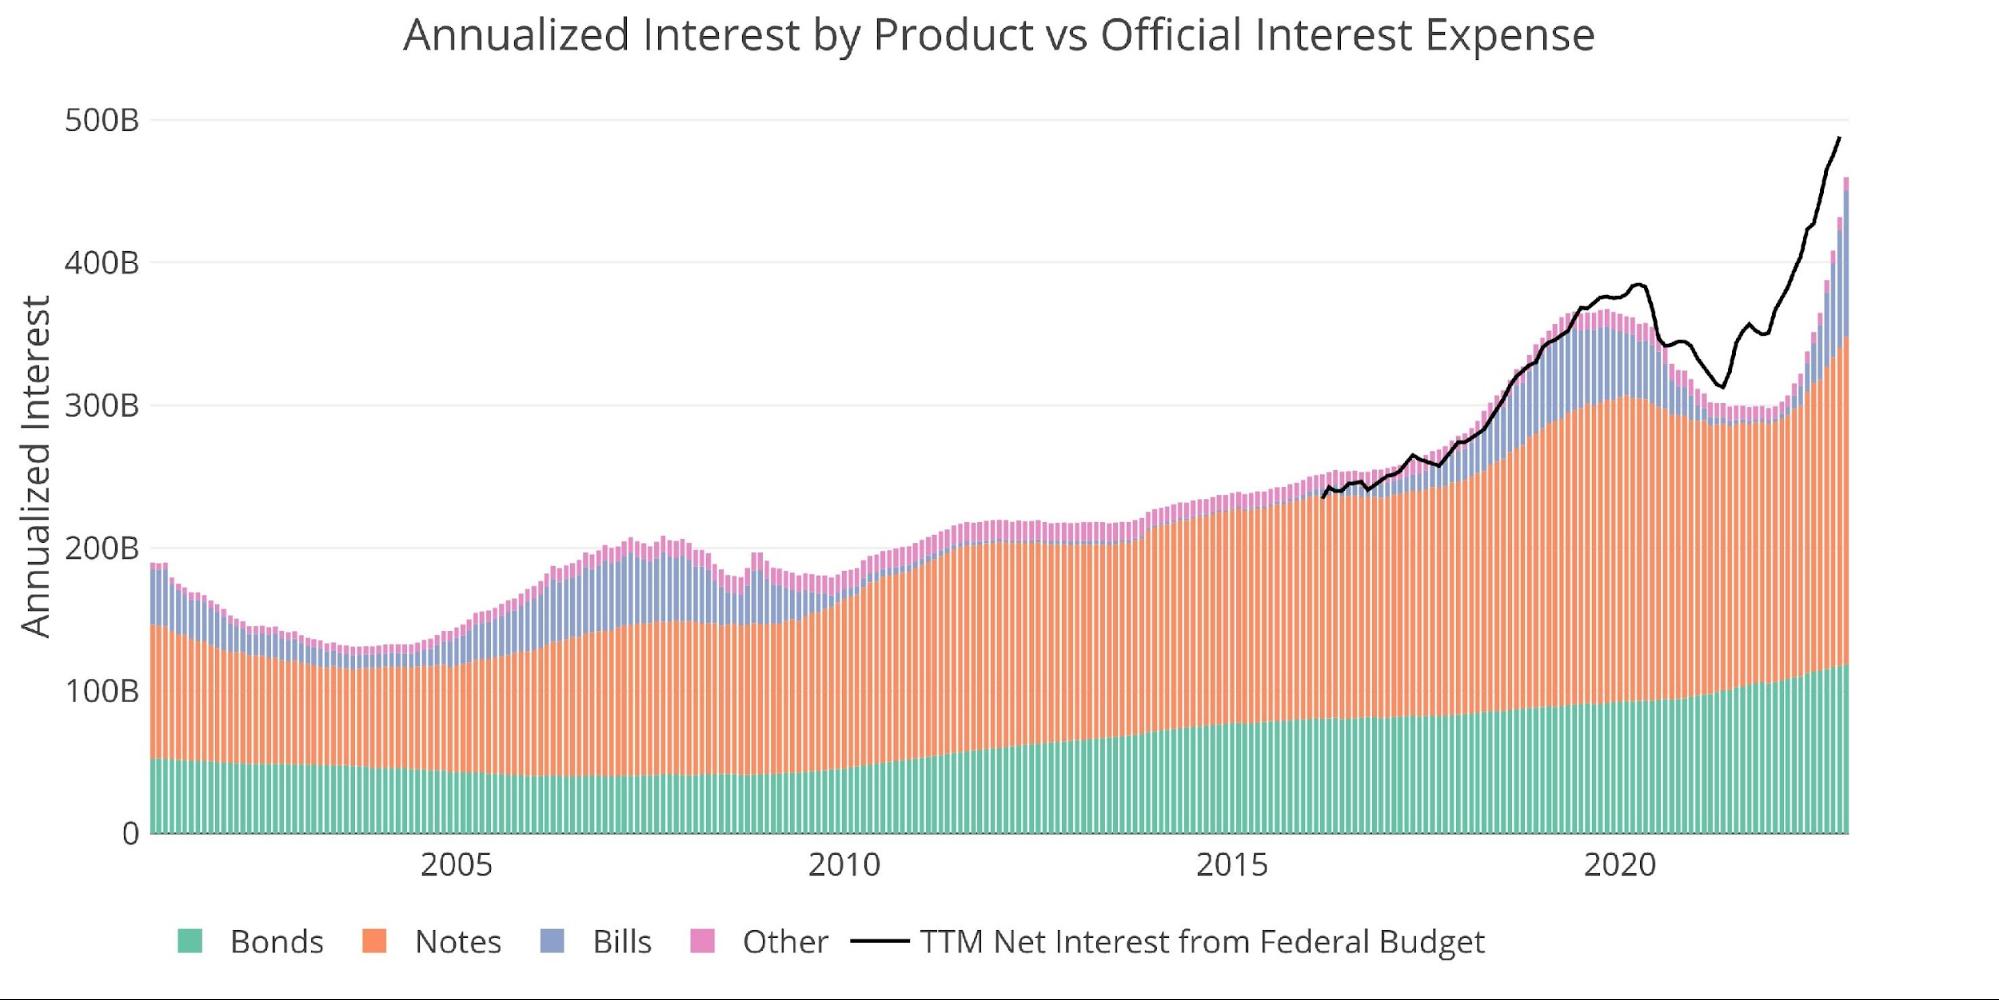
The Fed continues to talk a tough game about battling inflation, but the situation for the Treasury is getting uglier each month. The interest on bonds has been on a slow steady increase for years as the balance has grown. For Notes and especially Bills, the chart shows a dramatic spike in recent months that is completely unsustainable.
Figure: 4 Net Interest Expense
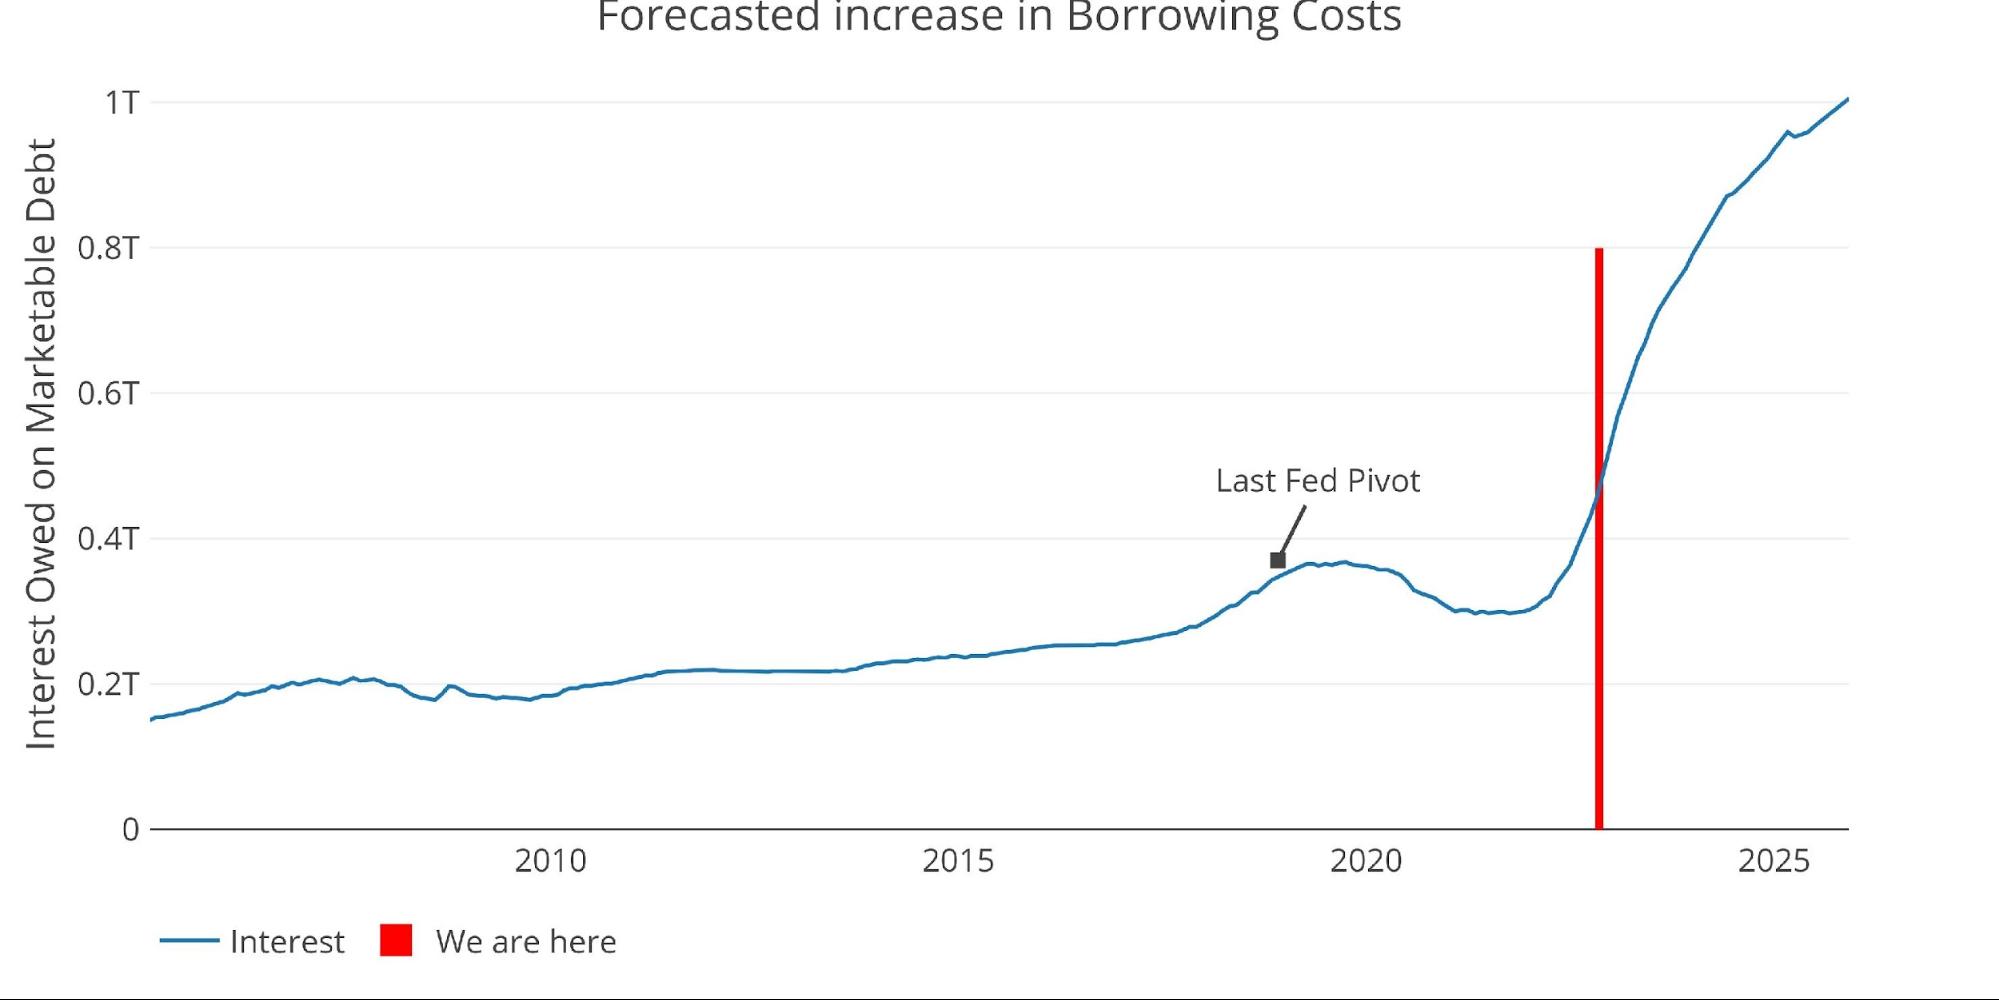
The chart below shows the gravity of the situation. In the latest month, annualized interest on marketable debt is at $459B, up $28B in the last month alone. Despite this massive run-up, the trajectory is still looking dramatically worse as existing debt is rolled over. By March, annualized interest is set to be $600B, reaching almost $700B by July.
This means that on the current path, the Treasury will owe an extra $200B a year in interest within just 8 months!
Please note: for simplicity, this model assumes the same (conservative) level of interest rate for all securities. It also only looks at Marketable debt and assumes $1.5T a year in new debt, which is less than the current year, and does not consider increased spending and lower tax revenues from a recession.
Figure: 5 Projected Net Interest Expense
The annualized interest is surging because so much debt needs to roll over at much higher rates. The chart below shows how much debt is rolling over (~$1T per month). Much of this is short-term debt, hence the steep drop-off in the light green bars, but each time the Fed raises rates, the impact on the Treasury is nearly immediate. This can be seen by the massive spike in short-term interest owed in the chart above.


