

by Mark Mead Baillie, Gold Seek:
…does it not stand to reason that “Everybody’s” selling Gold? After all, for every ounce bought, it must be sold to the buyer, non? ‘Tis merely the agreed-upon hitting of available bids and offers that makes the price change. But is such wise word to the Fin&Social/Media sufficient? Likely, no. Regardless, let’s go to Gold’s Moneyflow. Similar to the website’s MoneyFlow graphics for the S&P 500, below we’ve regressed Gold’s Moneyflow into points such that it can be directly compared with the actual change in price. To wit, this three panel display (one week, one month, one quarter) wherein the green line is the cumulative points difference between Gold’s price change and its MoneyFlow:
TRUTH LIVES on at https://sgtreport.tv/
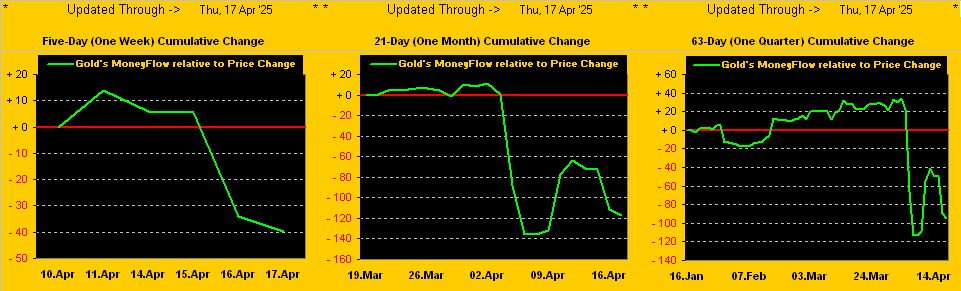
“So what’s with that big dip there, mmb? Because Gold is basically at a record high…”
Simple, Squire. Recall after Gold’s having settled at 3190 on 02 April came three robust rounds of selling, price then closing at 2999 on 07 April. The “big dip” — as you put it — merely indicates that the amount of money by points regression which flowed out of Gold hardly in full has flowed back in, even as price as risen to yet another All-Time High at 3372 this past Thursday, toward settling the abbreviated trading week at 3341. In fact, across the past nine trading days (07 – 17 April), Gold’s day-over-day contract volume declined for six of them, (see too our closing graphic).
“Well, none of THAT was on FinTV, mmb…”
Nor would it be, Squire, given their WestPalmBeacher audience. The point is: MoneyFlow ultimately leads price. And as you regular readers know, price at present remains technically well-extended above its BEGOS valuation line per this year-over-year graphic:
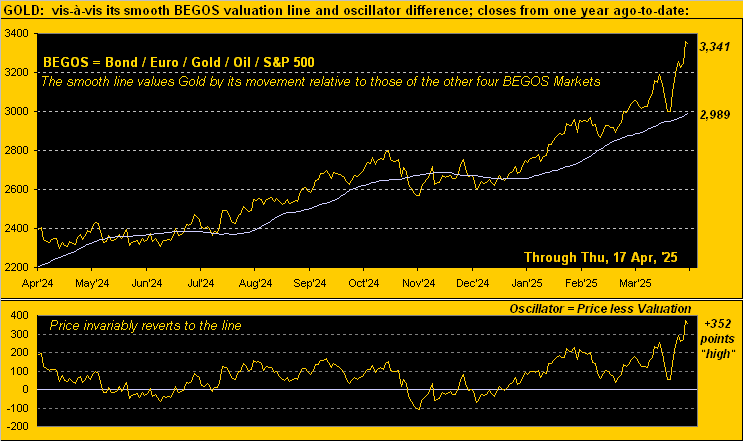
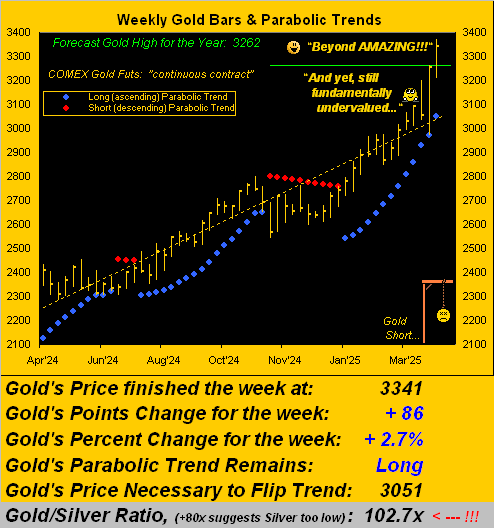
To be sure, “mis-valuation” — whether technical or fundamental — seems oft “forever” sustained in markets (a prime example being the S&P’s ongoing post-COVID extreme over-valuation). Obviously, one cannot “will” price to be elsewhere. For ’tis axiomatic that price itself net of its bids and offers is never wrong; Gold therefore by its weekly bars and parabolic trends from a year ago-to-date is ever right:
Gold’s All-Time Closing high was recorded this past Wednesday at 3358. ‘Twas but half that at 1679 a mere 2.3 years ago as encircled in the following table of Gold’s closing price “doublings” since 1975, which was the first full year featuring Gold futures at the COMEX:
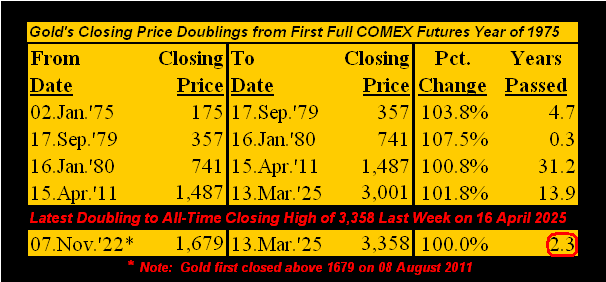
‘Course per the table’s footnote, Gold first achieved the 1679 closing level some 14 years ago on 08 August 2011. That — for those of you scoring at home — means Gold was net “unch” after 11 years despite a harrowing route.
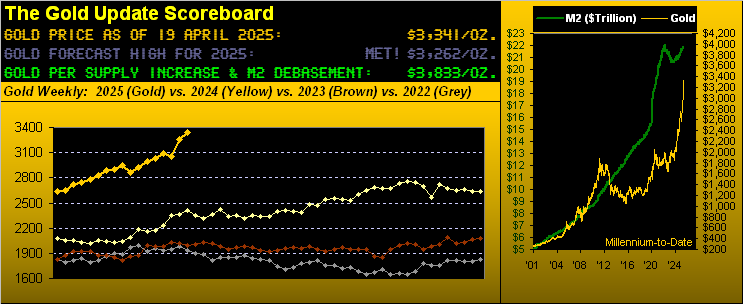
Veteran readers may remember back in 2011 our penning about price “having gotten ahead of itself”, after which Gold was severely sold — indeed way oversold — to as low as 1047 on 17 December 2015. ‘Twas exemplary of Gold’s trials and tribulations as it fell far behind the Dollar debasement curve, which is de facto the most acute tool to value the yellow metal per our opening Gold Scoreboard.
Fast-forward to today at 3341, Gold still is -13% below the Scoreboard’s value of 3833. Assuming that flexing level is graphically eclipsed (and we’re still around), we’ll again write of Gold “having gotten ahead of itself”. Certainly at present, the Gold hype is ripe with 4000 in sight … which likely means it shan’t get there anytime soon. Again given Gold’s expected yearly trading range — and assuming the 2625 low (06 January) holds — 3400 may well be Gold’s top for this year should “TT” (“Trump Tariffs“) reach some accord and Europe not be sucked into war.
