by Ed Steer, Gold Seek:

Back in early March of 2015 I penned an essay with an identical headline… except for the year. It was something I presented at a Casey Research conference in San Antonio, Texas way back then. So, after almost ten years, it’s time for a revisit — and update. [Note: I’d link the original article from the Casey Research website, but it’s no longer active.]
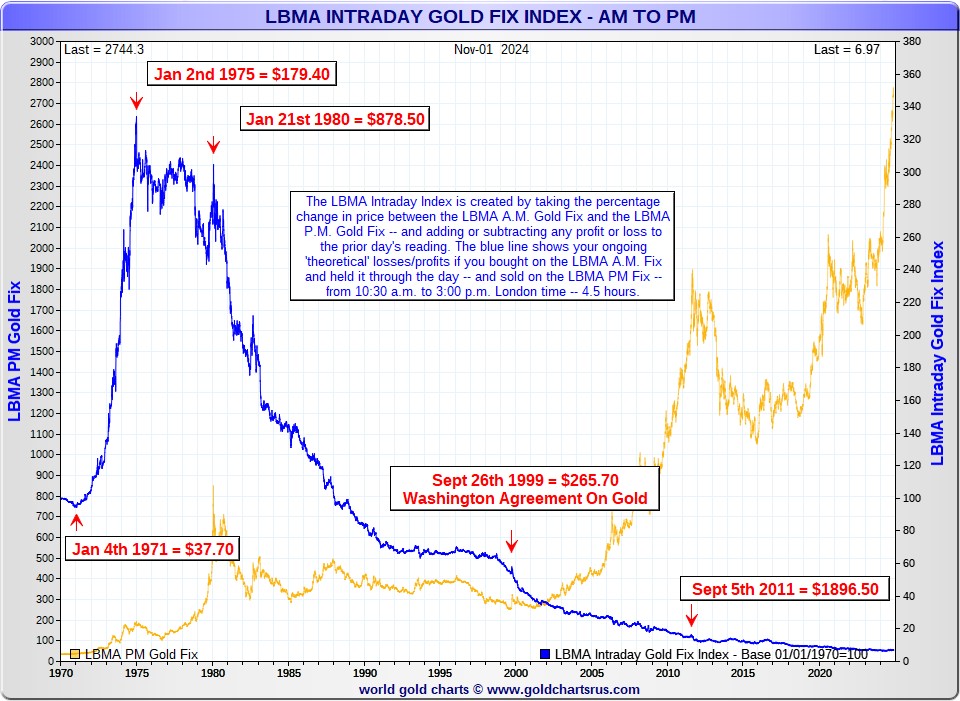
Both of the relative charts are simplicity themselves. The yellow line is Nick’s proprietary LBMA a.m. and p.m. gold fix index for the last 54 years — and slaved to the left axis. The blue trace is the theoretical value of an original $100 investment [ignoring any commission or transaction fees] — and is slaved to the right axis. Click to enlarge.
TRUTH LIVES on at https://sgtreport.tv/

This first chart shows what happened to your $100 investment if you’d bought at the 10:30 a.m. GMT morning gold fix in London — and then sold it at the 3:00 p.m. GMT afternoon gold fix starting on the first trading day of January 1970…then reinvested that $100…plus or minus any gains or losses…the following day at the morning gold fix — and sold again at the p.m. fix once again.
If you did this every business day for 54 years, your initial $100 investment would be worth US$6.97 today. Of course that doesn’t include the loss due to currency debasement over that time…so in other words, you lost everything.
How is that possible since gold’s low tick of US$37.70 on 04 January 1971 — and its US$2,749.20 December contract close on 01 November 2024?
In the beginning, your $100 investment had risen to around $335 by January 2, 1975…when gold rose from $37.70 to $179.40…see the red arrow…and then stalled there.
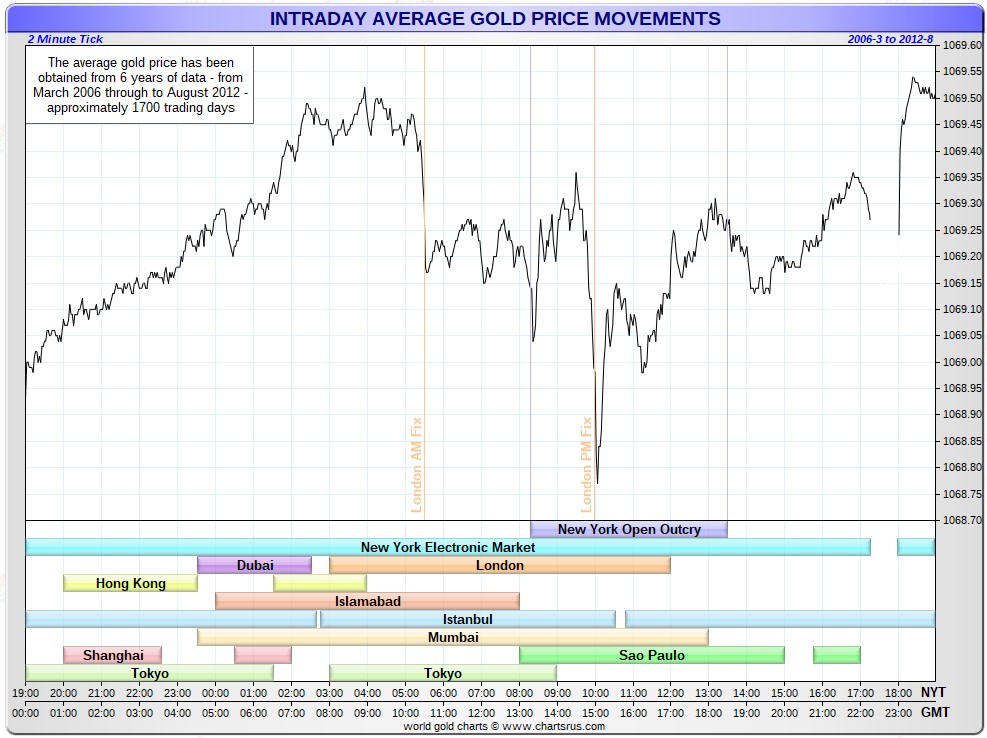
What happened on that date? That’s when the COMEX futures/paper market in gold commenced in New York. Then something strange began to happen. From that point on, the morning gold fix in London…with exceedingly few exceptions …was always higher than the afternoon gold fix. The chart below from Nick Laird only covers a few years…from March 2006 until August 2012…but it proves the point. Click to enlarge.

That’s why, despite the fact that the gold price rose from $179.40 on January 2, 1975…up to $878.50 on January 21, 1980…that your $335 investment got whittled down to about $305 at gold’s high tick way back then….despite gold’s $700 gain during that 5-year time period.
Don’t forget that you’re reinvesting your proceeds at the morning fix — and selling at the p.m. fix — and if the latter is always higher than the former… then your investment gets whittled away in the process…regardless of what happened between the fixes, or after them, during that time period. After 54 years, your hundred bucks is down to the aforesaid mentioned US$6.97 which wouldn’t buy you a decent caffè latte at Starbucks.
That’s the power of a higher a.m. fix — and a lower p.m. fix over the long term on an investment strategy such as this…which is only theoretical — and can’t be pulled off in real life. I don’t know how old you were at the time this all started, dear reader…but I was 26 years young at the beginning of 1975 — and turned 76 last month. That’s how long this paper price suppression has been going on in gold.


