

by David Jensen, Jensen’s Economic, Precious Metals, & Markets Newsletter:
 Saddle Up
“If you can’t take a small loss, sooner or later you will take the mother of all losses.”
Ed Seykota
Silver shortage is kryptonite to the system of setting silver’s price with leveraged cash/spot promissory notes in London’s cash silver market – the world’s largest cash physical silver trading market by volume. A promissory note is no substitute for a silver bar when the market encounters physical shortage.
TRUTH LIVES on at https://sgtreport.tv/
As noted previously, exposure of bullion banks short silver in the London market is estimated to be between 4.3 billion (B) and 6.4(B) oz. representing an existential threat to the bullion banks themselves as London price control is eroded due to an increasing, now chronic, global silver shortage.
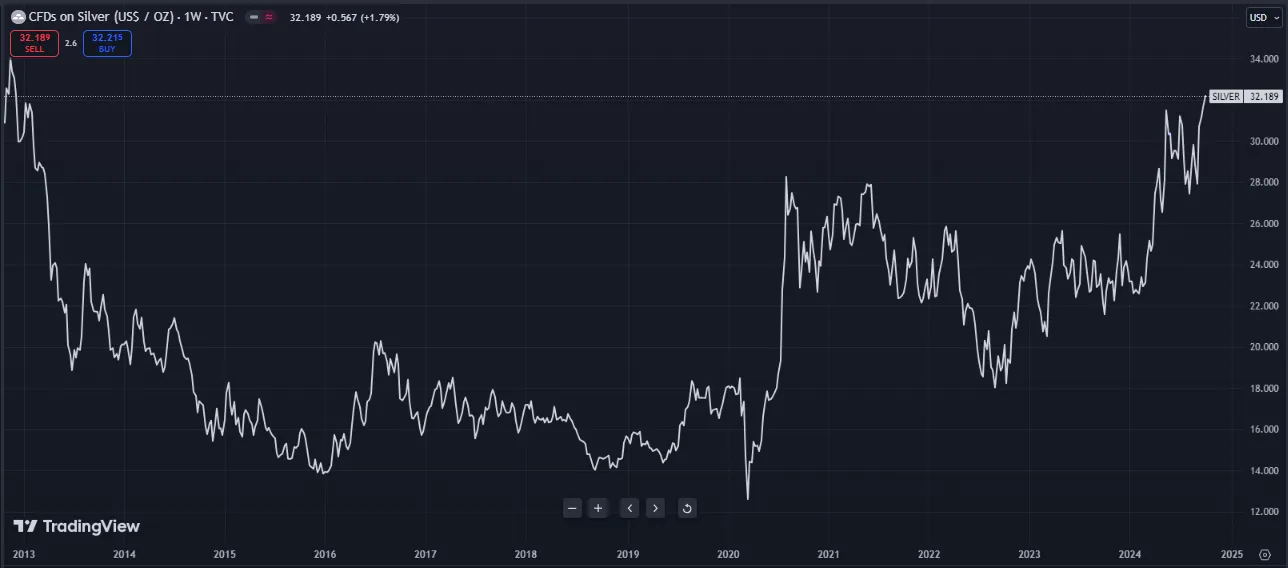
With the weekly price of silver surging to close on October 4, 2024 at the highest price in 11 years (see Figure 1 below) our attention is drawn to metrics that indicate market silver shortage and the increasing potential for major bullion banks to be upended from their geared London short position should the price continue to drive higher.
Figure 1 – Spot Silver Price (Weekly) 2013 to 2024; source: TradingView.com
Short term silver lease rates that indicate the cost for traders, who sell promissory silver notes into the market, to borrow silver when delivery is demanded by the note buyer have been elevated since 2022.
In the week of October 4, 2024 the 2-month implied lease rate for silver has surged to close at 2.16% – a level of tightness seen over the last two years of shortage that had previously occurred during the 2008 Financial Crisis.

Figure 2 – Silver Implied Lease Rate; source: GoldChartsRUs.com
A strong demand for physical silver is further supported by a snap-back in the premium paid for silver in Shanghai compared to New York rising back to 8.85% at September 30, 2024 – see Figure 3 below.

Figure 3 – Shanghai Silver Premium vs NY; source: GoldChartsRUs.com
Finally, the net short position of New York Swap Dealers (bullion banks) shown by the blue line in Figure 4 below shows that as the price of silver has risen from $22 /oz. to $32 /oz., bullion banks have been unwilling, or are unable, to cover their shorts even as losses have mounted for these banks.
While the net short position of Swap Dealers stood at 42,096 contracts equating to 210.5M oz. in NY and is much smaller than the London bullion bank short position, it is of note that bullion banks appear to be unable to cover.

Figure 4 – CME COMEX Silver Market Prices and Net Positions; Source: tradingster.com
The delay in risk managers’ calls to bank traders to cover their COMEX short positions may be influenced by the fact that the largest risk to bullion banks is from a further rise in the price of silver in NY and London that they could stimulate by covering, driving a further surge in demand for physical silver due to its Giffen Good nature and thereby destabilizing or ending the dominant London promissory note price setting mechanism.
Read More @ jensendavid.substack.com