by Steve Kirsch, Steve Kirsch’s newsletter:
 Buy hey, nobody who works in public health actually cares how many people are killed by the lack of quality control on these vaccines. They are “safe and effective” even when they aren’t.
Executive summary
Batch analysis of the Czech Republic data comparing 1-year post-shot all-cause mortality rates shows some batches are 3X deadlier than other batches from the same manufacturer when given at the same time to the same age 5-year age group.
And a Moderna batch can be 8X or more deadlier than a Pfizer batch given at the same time to the same age group.
TRUTH LIVES on at https://sgtreport.tv/
This cannot happen if the vaccines are safe.
Replicating the analysis
You can generate the csv file with the batch analysis (vax_4.csv) by cloning the Github repo, going to the code directory and typing “make vax.”
If you just want to work with the data without regenerating it from the source, you can download the vax_4.xlsx file here.
Feel free to analyze the data and publish your own analysis.
Over a 9X increase in all-cause mortality across brands
Whenever you do batch analysis, the fairest way is to compare the one year mortality rate between batches given in the same month to the same 5 year age range. This minimizes confounders.
For example, let’s look at all the Pfizer and Moderna batches given to more than 100 people in February 2021 aged 70-74 and compute the 1 year mortality from the time of the shot.

Do you see how there is a huge variation within the same brand, and an even larger variation across brands? For a safe vaccine, the1 year mortality rates should be very similar to each other. They are not. The Pfizer brands were within 2X of each other, but Moderna had over a 9X higher all-cause mortality.
Moderna PR will tell you, “Nothing inspires safety like knowing you are getting a 9X higher all-cause mortality by choosing Moderna!” They should do this… people will eat it up.
Of course, health officials refuse to look at the data and the public is never told of the quality control problem.
More than 3X all-cause mortality variation between Pfizer batches
You can’t have a 3X higher all-cause mortality that depends on which batch you get. That’s insane. Here are two batches given in the same month to the same 5 year age range. You can repeat this for other younger 5 year age ranges and you get the same factor of 3 so this is not a fluke.

The Fisher exact test shows it is highly unlikely that the two different batches are the same vaccine.
This means that the quality control is awful and is killing people.
If the safer batch is a placebo, the unsafe batch has a 3X higher 1-year mortality risk. That is a train wreck.
Statistics for FD0168 v FC2473, age 60-64, June 2021 = 72726 6190 178 48 79142
One-sided p-value 2.4151959748643023e-10
Two-sided p-value 2.4151959748643023e-10
Max likelihood estimate of the Odds ratio= 3.1681822516381675
Traditional OR= 3.1682561579931385
95% ConfidenceInterval(low=2.2512027025939814, high=4.384677734307545)
90% ConfidenceInterval(low=2.3777946479262617, high=4.176636898645071)
85% ConfidenceInterval(low=2.4632782490857394, high=4.045556338818763)
80% ConfidenceInterval(low=2.5307027036147893, high=3.947040392460762)
>>>
Also, they can’t argue that this is because the FC batch was distributed to those in nursing homes because the effect happens in those 64 and younger and it isn’t there for older people!
The batch analysis
Pandas and dataframes make it so easy to analyze data like this. It was just one line of Python code to add the batch analysis the analysis already there:
[‘age’, ‘brand_2’, ‘batch_2’, ‘date_2’]
To keep things compact (the .xlsx file is just 1.2MB in size), I just looked at the codes for shot 2, but I could have looked at any shot number.
So there is no excuse for the health authorities not having the resources to look at their own data.
This isn’t a statistical fluke
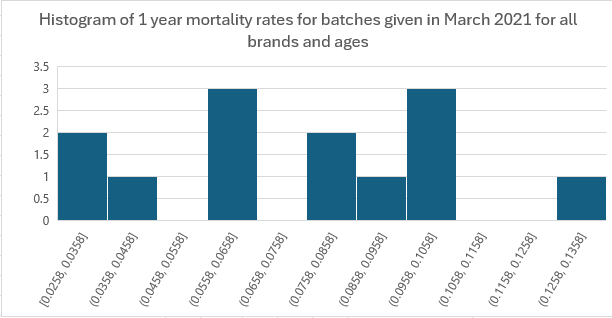
If the vaccines were safe, the mortality rates of the batches I looked at (given to a given group in a specific time period) must have a normal distribution. This is guaranteed by the central limit theorem.
So here’s one example. No normal distribution at all. Not even close.

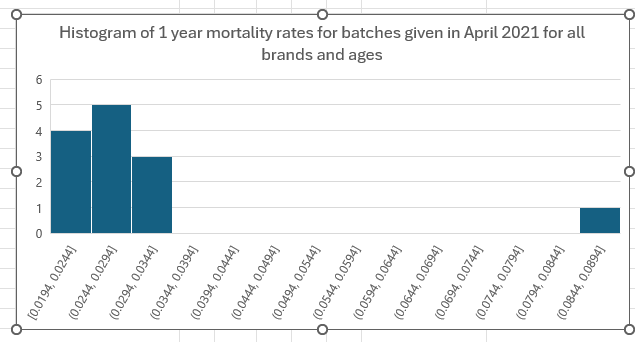
Same graph, but for April 2021 injections. See the outlier? That is unlikely to happen if the vaccines are safe. It’s Moderna batch 3000496.

CAUTION: The data has brand errors
Batch 3000496 is listed as associated with Moderna, Pfizer, and AstraZeneca. This appears to be a coding error on input.
Read More @ kirschsubstack.com


