

by Jeffrey Tucker, Daily Reckoning:
There was an oblique message buried in a recent New York Times story on the growing crisis in commercial real estate in cities.
Yes, this is exactly the kind of article that people pass over because it seems like it doesn’t have broad application. In fact, it does.
It affects the core of issues like our city skylines, how we think about urbanism and progress, where we vacation and work and whether the big cities are drivers or drains on national productivity.
TRUTH LIVES on at https://sgtreport.tv/
The note mentions the “broader distress brewing in the commercial real estate market, which is hurting from the twin punches of high interest rates, which make it harder to refinance loans, and low occupancy rates for office buildings — an outcome of the pandemic.”
The consequences will echo long into the future. The high interest rates are a result of trying to slow down the money spigot unleashed in March 2020, in which more than $6 trillion in new cash appeared out of nowhere and was distributed as if by helicopter.
What did the money injection do? It generated inflation. How much? Sadly, we don’t know.
Is the True Inflation Rate 19%?
The Bureau of Labor Statistics simply cannot keep up, partially because the Consumer Price Index does not calculate the following: interest on anything, taxes, housing, health insurance (accurately), homeowners insurance, car insurance, government services like public schools, shrinkflation, quality declines, substitutions due to price or additional service fees.
Those are a major part of what has gone up, which is why data on particular industries show a huge gap (groceries up 35% over four years) and why ShadowStats estimates inflation in double digits two years running, having peaked at 17%. Just adding in interest, a paper from NBER estimates, takes 2023 inflation to 19%.
Various studies have shown that since 2019 fast-food prices — a gold standard in financial markets for measuring true inflation — have outpaced official CPI by 25–50%.
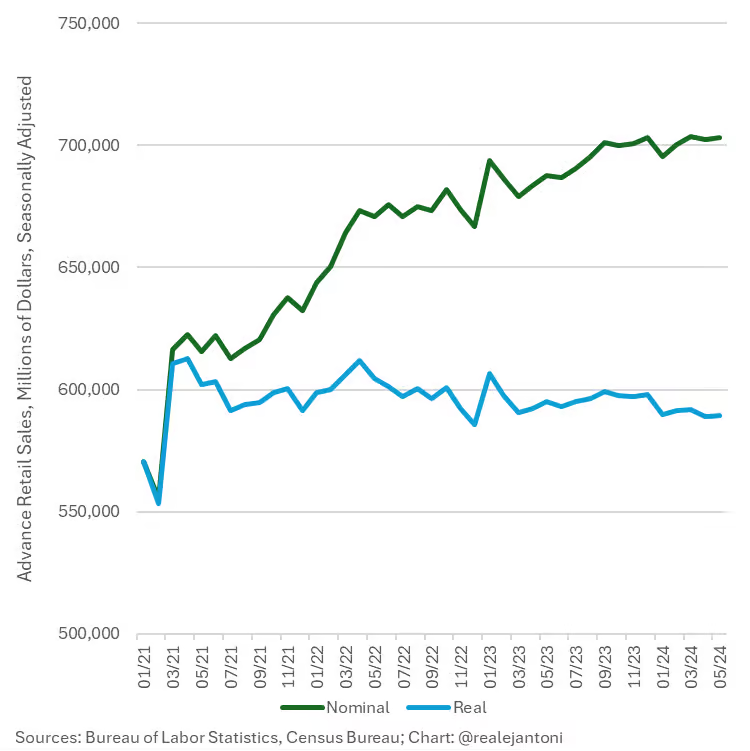
Getting the inflation data wrong is only the start of the problem. We’re lucky if any government data even adjusts for the wrong numbers. Consider retail sales as just one example.
Let’s say you bought a hamburger last year for $10 and you bought one this week for $15. Would you say that your retail spending is up 50%? No, you just spent more on the same thing. Well, guess what? All retail sales are calculated this way.
Get Real
It’s the same with factory orders. You have to do the inflation adjustments yourself. Even using conventional data, which are wildly underestimated, wipes out all gains of the last several years. E.J. Antoni is one of the few economists actually keeping up with this stuff, and he produces the following two charts.
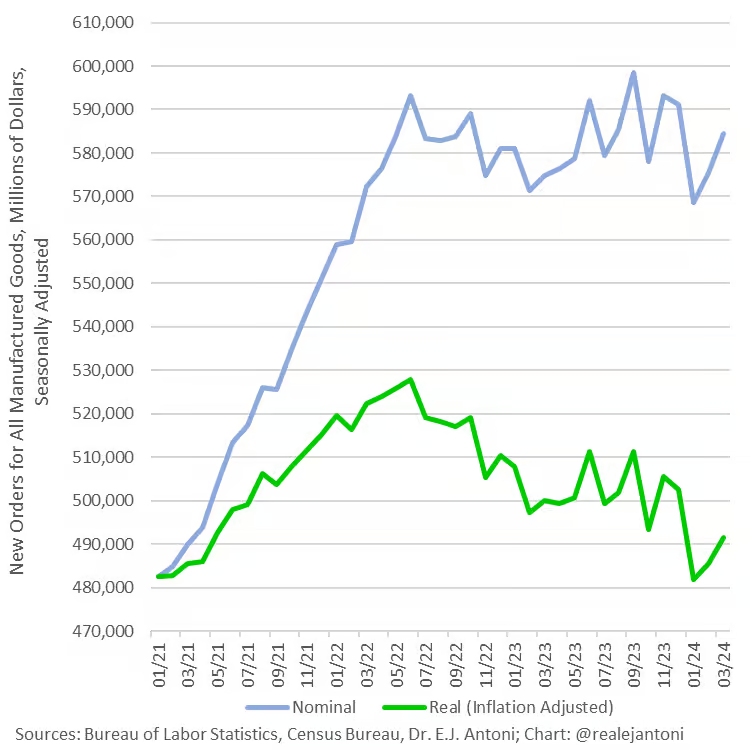
As E.J. writes: “This is factory orders before and after adjusting for inflation: What looks like a 21.1% increase from Jan ’21 to March ’24 is only a 1.8% increase — the rest is just higher prices, not more physical stuff; worse yet, real orders are down 6.9% since their high-water mark in June ’22.”
Imagine the same charts but with more realistic adjustments. Are you getting the picture? The mainstream data being dished out daily by the business press is fake. And imagine the same charts above redone with inflation in the double digits as it should be.
We’ve got a serious problem.
Read More @ DailyReckoning.com