

by Steve Kirsch, Steve Kirsch’s newsletter:
 This one chart is all you need to know. Deaths go UP. They are supposed to go DOWN.
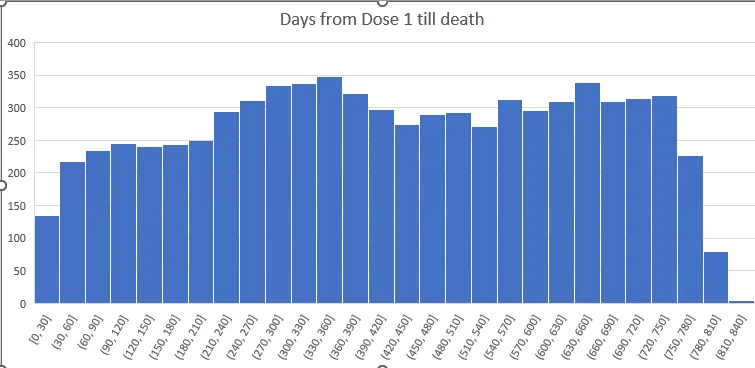
This is deaths per month since getting Shot #1 in the months of July, Aug, Sept 2021. The x-axis is the months since shot #1 was given. All ages are included so nobody accuses me of “cherry picking.” The deaths are counted relative to the day that the person got the shot.
TRUTH LIVES on at https://sgtreport.tv/

The reason this is so stunning is the deaths keep going UP every month for the first year.
This is counter to two strong forces causing it to go DOWN for the first 6 months:
- In a “safe vaccine” (if there was such a thing), the deaths per day always falls monotonically, typically a few percent or more if the cohort is older. There can be a short period of this being violated if something big is happening in the background and the shot was given over a short time period. For practical administration of a vaccine, the curves always slope down after a few weeks from day 0 (known as the temporal healthy vaccinee effect). The cause of this is it is a fixed size cohort and deaths are always proportional to the number of people available to die. This is why “relatively” safe vaccines (there are no safe vaccines) have deaths per day that always slope down.
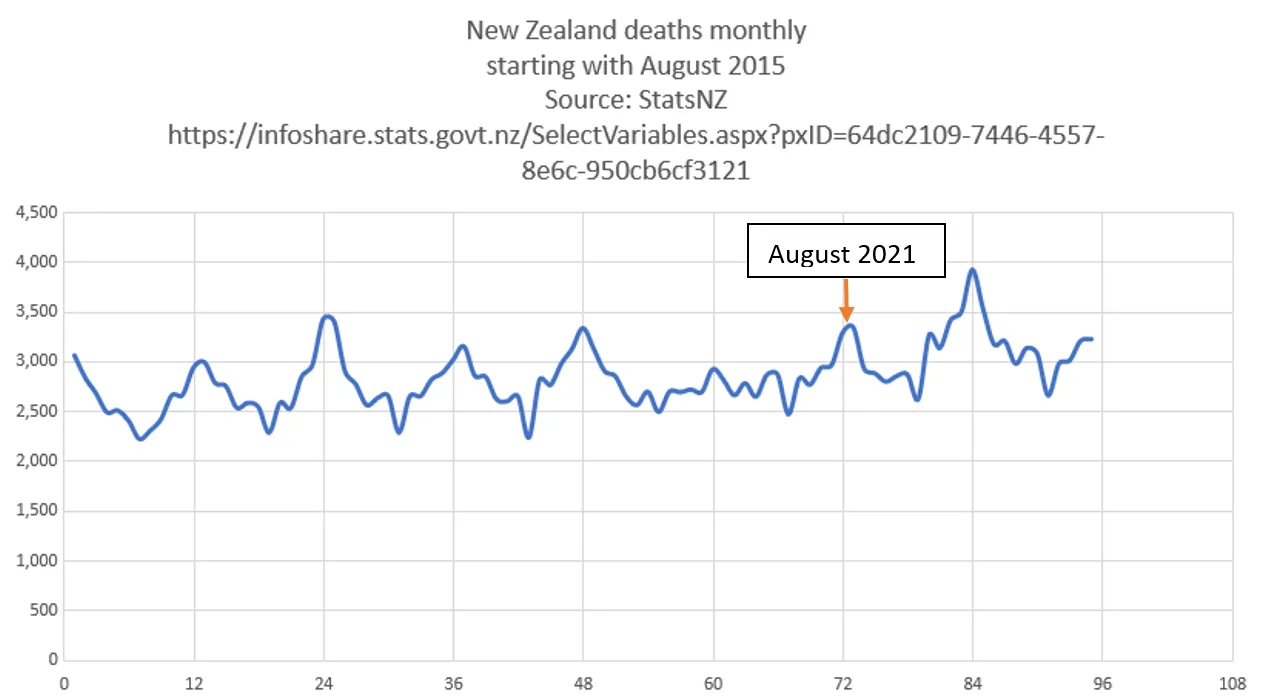
- August is a peak death month in New Zealand (the equivalent of our “winter” in the northern hemisphere). So I chose the peak month of death for when the vaccine is given and two months around that just to get more data points so there is less noise. So there is a heavy bias for deaths to drop over 6 months due to background seasonality (a 27% drop) effects (death rates going down dramatically.
Here’s the graph from data from StatsNZ and you can download it yourself here.
This is from August 2015 by month. The deaths peak every August and the peak to trough varies by 27% in 2021 (=3342/2628).
But if you get the shot, you are able to defy extreme “gravity effects” (both causing you to die at lower rates per week) and die at a higher rate every month for the next 12 months.
This is extraordinary and nobody has been able to explain it if it isn’t caused by the COVID vaccine.
There is no explanation other than it was the vaccine
- There is no COVID (that didn’t start till April 2022),
- no seasonal effect (it worked to strongly reduce the number of deaths since the vaccination date), or
- anything else that would cause the deaths to increase each month. Indeed the background deaths from the chart above show clearly the strong seasonal effect causing deaths to decrease.
- The health status of the cohort who took the vaccine is immaterial. Whether it is healthier or unhealthier than average, it simply doesn’t matter: gravity always applies (see next point).
- “Gravity” causes deaths to go down (as mentioned above people die in proportion to the number available to die, and as the older die off, the cohort mix gets younger which counteracts the fact that people are a year older at the end). For all cohorts, the death rates monotonically decrease over time for a fixed size cohort at the start.
- Arguments claiming I’m not competent to analyze data or that I’m a bad person or falsely claiming the data was illegally obtained or that the data breaches people’s privacy are all untrue and irrelevant. People should stick to focusing on what the data is saying: a crime was committed and people are looking the other way.
So why did people who got the COVID shot find their mortality rate increase after the shot when it clearly should have gone down? Doctors are puzzled.
This is not a cherry picked example
This happens in every country, after each dose of the COVID vaccine, but not for other vaccines.
The data is all in the repository I set up for everyone to see. Look at the PNEU vaccine vs. the COVID vaccine in the US in 2021 and 2022. The PNEU drops, the COVID vax increases. It is really stunning.
Read More @ kirschsubstack.com