

by Steve Kirsch, Steve Kirsch’s newsletter:
 From the US Nursing home data, we can now prove that the vaccines increased the odds of death from COVID by 6%. I need 20 data scientists to validate my work before I submit to a journal.
Executive summary
TRUTH LIVES on at https://sgtreport.tv/
Emory University infectious disease Professor Carlos del Rio reviewed my work, thought it was flawed, and encouraged me to submit it to a peer-reviewed journal where he presumed it would be rejected.
When prompted, he was unable to articulate a single flaw and refused to talk to me.
So I’m going to follow his advice.
But before I attempt that, I want to make sure I have at least 20 peer reviewers who have reviewed my work. If there is a mistake, I want to find it before I submit it to the journal. I want to make sure this is bulletproof so that the journal will not have any excuses for rejecting this important result.
If you are a data scientist or epidemiologist who is willing to verify my result, this would be extremely helpful. Please sign up here.
Data source
US Nursing home data collected by CMS from 15,410 providers who submit COVID cases and deaths within their facility weekly since week ending 5/24/20.
This is the most comprehensive dataset on the single most important demographic for COVID:
- More than 40% of the COVID deaths were from nursing homes in the beginning of the pandemic.
- Older adults made up 90% of US COVID deaths in 2023
So if the COVID vaccine was or wasn’t effective for this group, this data would tell the story.
This data is also the most credible because there were over 15,000 independent observers. So we can look at the aggregated results while minimizing any systematic errors as might occur if the numbers were collected by a single entity.
Methods
I downloaded the raw data from the site (the .csv files). The data was processed using an R program.
The code and data analysis can be found in my github repo for this project. Everything was done in public view.
The code does the following:
- Reads in the .csv files
- Computes summary statistics for each nursing home
- Uses the stats in a set of QA checks. Then discards all data from those nursing homes with nonsensical aggregate results (e.g., deaths > cases). This resulted in the elimination of all data submitted by 2.3% of the nursing homes.
- Sums up the COVID cases and deaths for each week from all the remaining nursing homes.
Then using an excel spreadsheet, I summed the cases and deaths for N weeks before vs. after the vaccine rollout, using a 1 week delay for cases as per the work done by Mike Deskevich.
I looked at various values of N, with N=12 being the most reasonable to detect an effect. For all values of N between 1 and 24, the result showed that the vaccine increased the risk of death.
I used a demarcation date of the week ending 12/6/20 as the pre-vax period. The Excel spreadsheet (see the week tab in the top right) allows you to vary this and it didn’t change the result if you moved it later, e.g., by 3 weeks since the vaccination rollout was widespread by 12/27/20. In fact, it made the disparity worse for those claiming the vaccine reduced death (RR=1.066 vs. RR=1.049 for demarcation week offset=0).
Additional evidence relevant to the nursing home data
- All this data has been available publicly for at least 2 years. If the data showed the vaccines worked, why isn’t there a publication showing us that the IFR decreased. There are a few paper referencing this nursing home dataset which you can find here:
- Nursing Home Resident and Staff Covid-19 Cases After the First Vaccination Clinic which looks at cases, but NOT the IFR! The problem is that cases come and go and people falsely associate the going with the vaccine rollout.
- <more added shortly>
- It seems that some people believe that this is a CFR and not an IFR because nursing homes didn’t test everyone every day. Nursing homes only tested symptomatic people. The deaths/cases ratio here is about as close to an IFR as you can get. A CFR is applicable to large populations where 100% of the population who is symptomatic cannot be centrally screened. By contrast, nursing homes are closed environments where if you are sick, the staff notices. Also, the testing policy (test residents who exhibit symptoms) never changed over the period (no new instructions from Medicare or the CDC).
- Nobody who discounted my analysis was able to articulate what the “correct” IFR was prior to the vaccine rollout. They all avoided answering the question. If you don’t know what the right answer is, how can you be certain that the reported data is wrong? The answer is simple: you can’t.
- Professor Jeffrey Morris’s critique is that 1) you don’t have infections and deaths for the same cohort and that 2) the data doesn’t include the vaccination status of the infected and dead. He says that because of those two things, you cannot publish any paper making any kind of observations about the data. That is simply stunning. The corollary is that all ecological studies ever done should be retracted by every journal; for example studies saying highly vaccinated countries have lower mortality should be retracted because you don’t know the vaccination status of the dead.
- The IFR matches numbers found in peer-reviewed studies. The John Ioannidis paper, Infection fatality rate of COVID-19 in community-dwelling elderly populations, says “Median IFR in all elderly for all 11 high-income countries was 4.5% (range 2.5–16.7%).” We found an IFR in the nursing homes of 16%. But the nursing homes only tested symptomatic patients. Nearly 78% of original strain COVID infections are asymptomatic so that means our 16% should be reduced by a factor of 4.5 to get the true IFR (our IFR was calculated based on symptomatic cases). 16%/4.5=3.5% so we are squarely in the range of the Ioannidis paper. Since we are under the median IFR, it means that we are not “missing” tracking any significant number of cases (see Limitations section), i.e., if there were missing cases that we weren’t seeing, this would lower our IFR even more and it is already well within the expected range.
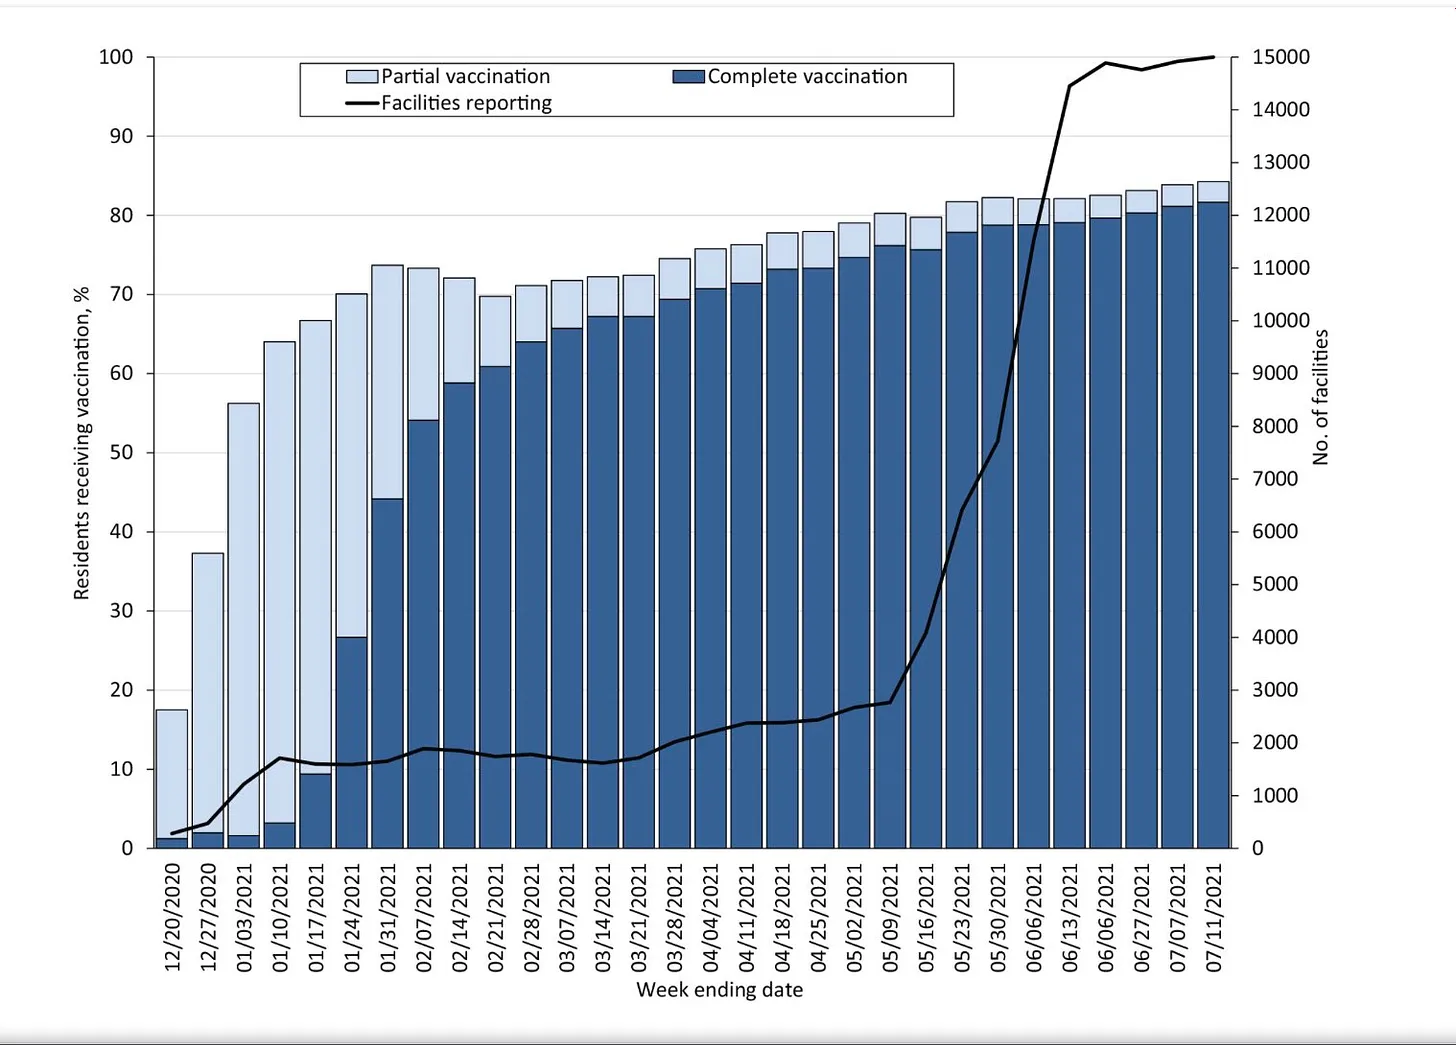
- This JAMA paper, Infections, Hospitalizations, and Deaths Among US Nursing Home Residents With vs Without a SARS-CoV-2 Vaccine Booster, shows a VE of 87.9% in System 1. So that’s comparable to the NSW claims. So if the vaccine really did that, the effect would be easy to spot in the US Nursing home data. It’s impossible to spot. Also, that paper shows that the booster shots take effect almost instantly since you can see from Figure 1C that the slope difference between boosted vs. unboosted is dramatically different on Day 7 after the shot. But a booster provides nearly no benefits as we can see in our data, so that means that the effect of the primary series should be even more dramatic. By day 7. So this means that certainly by Feb 7, 2021, which is well after half the nursing home population is fully vaccinated (see chart below), we’d see a huge IFR reduction vs. baseline. Baseline IFR on 12/6/20: 0.171526 Feb 7, 2021 IFR: 0.17958. There was no reduction. It actually increased! Maybe we should wait 30 days after the nursing homes had half the residents who were fully vaccinated. OK. On March 7, 2021, the IFR value for the week was 0.219485. Even worse! This is a HUGE HUGE problem.
- The JAMA paper (Table 3) says that there was a CFR for the System 2 unboosted of 2.4/171.2=.014 per 1K residents. But for the boosted, the case fatality rate was higher at 1.3/72.5=.0179. So it was 28% higher CFR for the boosted. But the claim was the boosted die significantly less. This result wasn’t statistically significant because the total number of deaths was too small in the study (18 for System 2 even though the numbers in Table 3 didn’t match up with what the text said which was 18). But if the vaccine really reduced deaths by 10x, getting a 28% higher for the CFR of the boosted is very unlikely (about a 1% chance in this case). Note that the CFR of between 1.4% and 1.8% is comparable to the numbers in my spreadsheet (IFR=.035 on 3/6/22).
Read More @ kirschsubstack.com
