

by Craig Hemke, Sprott Money:
What a crazy month this has been for gold prices. In a complete reversal from where prices began the month, we’re set to finish October on Tuesday with a big green candle on the monthly chart. What, if anything, does that signify? Let’s discuss that today.
The month of October began just four weeks ago, but it seems much longer than that. Geopolitical events and the worsening conflict in the Middle East have made October feel like the longest month of the year. Looking back, do you even recall how poorly COMEX gold was trading as the month began?
TRUTH LIVES on at https://sgtreport.tv/
Once the September FOMC meeting concluded, gold prices began to sell off, and through the first week of the month, things were getting pretty ugly. Between September 21 and October 5, the COMEX gold price declined ten out of eleven trading days for a total loss of over $131. It was nasty.
But then, with the sudden onslaught of hostilities in and around Israel, prices began to rally. Why? Two primary reasons:
- Gold prices typically rally as a “safe haven” in times of geopolitical stress; and
- Concerns over a wider war in the MENA region have led to a sharp drop in the likelihood of any further FOMC rate hikes this year and have increased confidence that there will also be no further rate hikes in 2024.
Gold Prices Charts
As such, the COMEX gold price gapped higher on the evening of Sunday, October 8, and have consistently rallied over the three weeks since. See below:
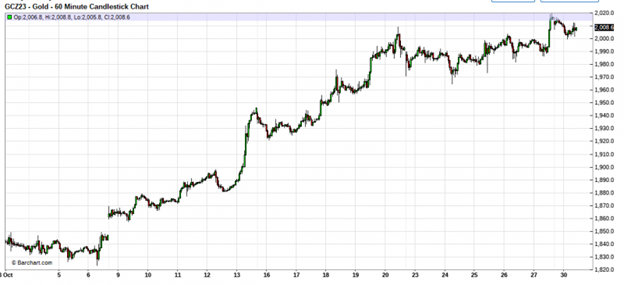
So the question becomes: where do prices go from here? Well, this week is going to be particularly busy with all sorts of U.S. economic data, another FOMC meeting and Powell press conference, and then we end the week with the latest U.S. jobs report. Along the way, any improvement or worsening of the situation in and around Israel will, obviously, impact things too.
However, the month ends on Tuesday and the monthly charts are always instructive when it comes to discerning the long-term trend in prices. As I type this on Monday, the 30th, there’s still time for the COMEX gold price to move in either direction, so printing and analyzing a monthly chart is a bit premature…but let’s do it, anyway.
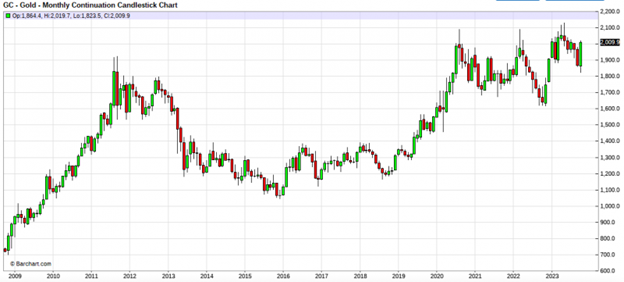
The chart below is a monthly “continuation” chart. The current front month on COMEX is the Dec23, and this chart shows the monthly closes of each year’s December contract, going back to 2008. The contango of the board distorts the early-year price somewhat, but regardless, you can see where a monthly close north of $200 is pretty rare, having only occurred on three occasions earlier this year.
To make this easier, maybe we should use the monthly chart of spot gold? I don’t like to use the spot price because, as Ned Naylor-Leyland famously said, “the futures tail wags the spot dog”. However, in this case, the monthly chart of spot paints a clearer picture.
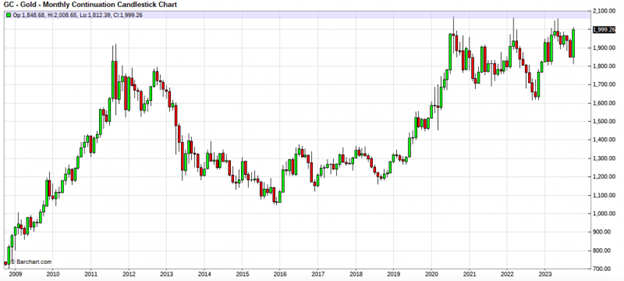
AHA! Now we’re onto something! If you look closely, you’ll see that the spot price has never closed a month above $2000/ounce. As in never, ever! So that’s definitely something you’re going to want to watch on Tuesday. Can spot gold close that day above $2000? You can bet that the Bullion Banks will want to avoid this fate, so expect all sorts of volatility in the final hours.
But regardless of which chart you prefer, be sure to note the size and scope of this month’s green candle. Notice that it’s a reversal of last month’s red candle and that it fully “engulfs” the September candle too. This potentially makes it a “bullish engulfing candle,” which usually foreshadows more gains to come.