by Craig Hemke, Sprott Money:
It was a grueling summer for precious metal enthusiasts, as gold and silver prices have remained in the same downtrend that began in early May. All trends eventually come to an end, and this one will, too, but at what price levels? Let’s take a look at the charts and see if we can find some clues.
TRUTH LIVES on at https://sgtreport.tv/
The Future of Gold and Silver Prices
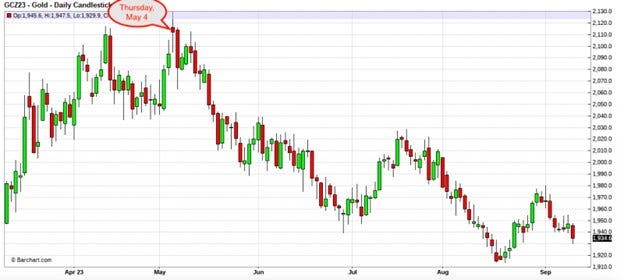
First of all, what changed in early May? Prices had rallied from the February lows on the back of concerns for the banking system in the U.S. Those issues were addressed via a whole host of new programs from the Federal Reserve and, after 60 days of worry, Fed Chairman Jerry Powell declared the whole thing a success at his post-FOMC press conference on Wednesday, May 3.
COMEX Gold’s Downtrend
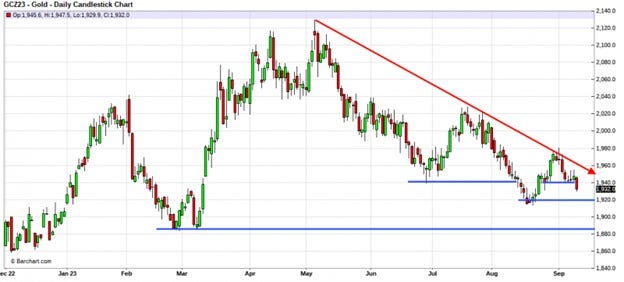
As you can see on the chart below, the price of Dec23 COMEX gold has been in a steady downtrend of lower highs and lower lows ever since. It’s now down nearly 10% over the past four months. Yuck.
In the end, we’ve spent all of 2023 waiting for Powell to signal that the current policy of higher interest rates was about to shift to a policy of lower interest rates. The thinking was… and remains… that economic stress, brought about by the unprecedented rate of rate hikes, would force the Fed to reverse course in order to stave off an impending recession. The FOMC meeting of May 2-3 made it clear that this policy shift was still months away and precious metal prices have suffered ever since.
Could that be about to change, however? The answer is “yes,” and the most significant clue will be coming on Friday, October 6, with the next U.S. employment report. The month of September is seasonally very weak for job growth, at least as it relates to the methodology the BLS uses to compute job growth and the unemployment rate. If form holds, then the data due on October 6 will provide the strongest clues yet that the U.S. is slipping into recession, and this should prompt the COMEX metals to end their downtrend and rally into year end.
Between now and then, however, there may be more weakness to come, and anyone looking to add to their stack of physical metal should keep the charts below in mind.
Anticipating COMEX Gold’s Price Bottom
Let’s start with COMEX gold. Again, the current downtrend has persisted for over four months! It will bottom soon… but at what price? First, look for support at $1920. This level has been both support and resistance over the past three years, if anything because it’s the old all-time high from back in 2011. It should offer support again in the days ahead. However, price may not fully bottom until they reach the same levels attained back in late February and early March… somewhere just below $1900. For my personal stack, I’ll be looking to add if/when price gets near $1890 or so.
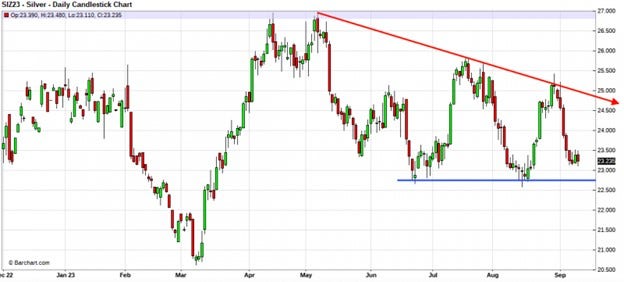
Silver’s Potential Bounce
For COMEX silver, it seems logical to expect another bounce and spec short squeeze from a price level just below $23. The two previous rallies within the downtrend have both brought gains of nearly 10% in a few days, and the next one is likely to do the same. But then what’s next? The key will be to watch the downtrend line that, like COMEX gold, stretches back to May 4. Once that line is broken, we can begin to feel confident that the downtrend is broken and that a new uptrend has begun.