by Peter Koenig, Global Research:

Climate change – climate change – climate change – the world is burning. The Global North with the CO2 emission is the culprit. Weather maps in Southern Europe and Australia are deep red. Add an invented degree or two, and they are going to be black.
News are talking about 48 to 50 and more degrees C in Spain, Southern Italy, Sicily, Greece. Scary. Hardly anybody notices and reports that the temperatures are largely exaggerated by the media, to cause a fear and guilt effect. Possibly a precursor to heat-lockdowns.
Meteorologists are part of the lie-game. Often, for fear and shock effect, they are reporting ground temperatures instead of air temperatures which are usually measured 2 meters above the ground and are typically 10 or more degrees C lower than ground temps.
TRUTH LIVES on at https://sgtreport.tv/
It is like MK-Ultra has been socialized: When people see the deep-red-colored weather map and are being told that temperatures are at record heights, in the upper forties into the fifties, they feel the burning heat, they feel it is much hotter than other years, when in fact it is not.
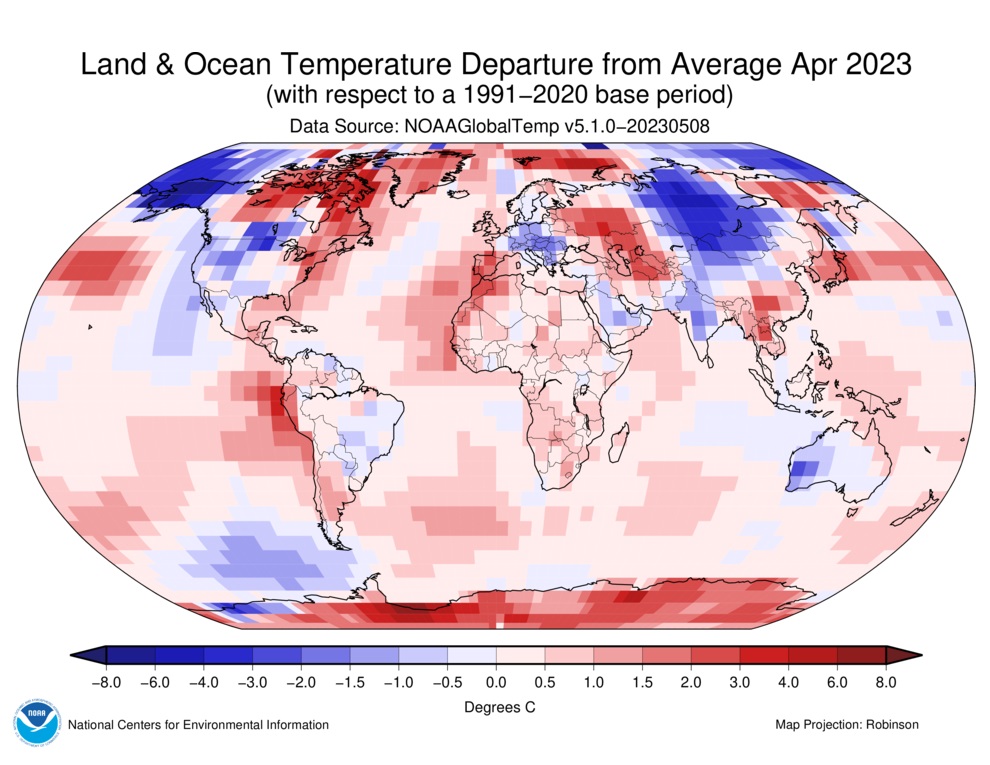
This is the map that climate researchers themselves use.
TEMPERATURE DEVIATIONS FOR LAND AND SEA, APRIL 2023 relative to the temperature normal, the average for the years 1991–2020. In this map, which uses a clearly indicated and color-coded temperature scale that the scientists themselves use, the temperature deviations we reported about over the last few months from North and South America, Central and Eastern Europe, and Central Asia, with hard-hit Mongolia, India, and Australia, are confirmed. This is despite the fact that critics argue it consistently shows higher temperatures due to non-representative and then tampered with measurement data. Source and map: NOAA 
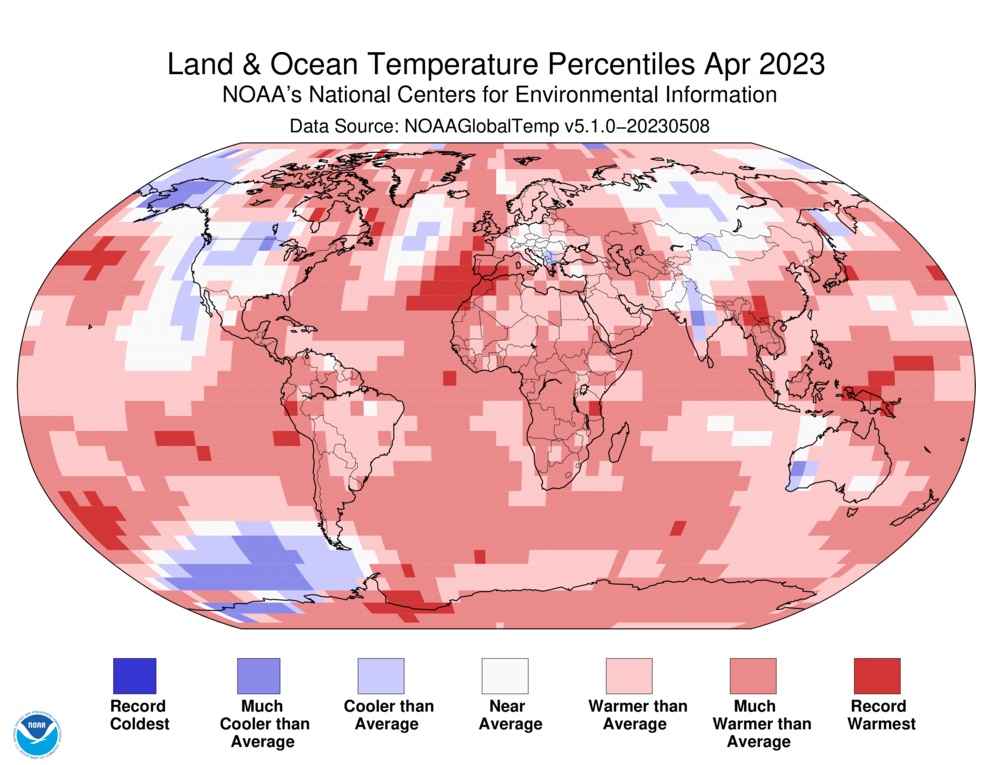
TEMPERATURE PERCENTILES FOR LAND AND SEA, APRIL 2023 based on an unspecified average. Here we can see that the Benelux countries, where Belgium and the Netherlands in April were 1.4 and 1.1 °C cooler than the climate normal 1991–2020, are falsely presented as having had an April average temperature “Above average” or “Much above average”. Central and Eastern Europe, which were much cooler than normal in April—for example, Czech Republic, Slovakia, and Serbia were 2.1 to 2.8 °C below the climate normal in April, which is significant in a climate context—are marked as “Near average” with misleading neutral white color. Source and map: NOAA
For more details see GR article entitled Climate Maps Manipulated to Mislead the Public
This is a list of heatwaves going back 500 years, demonstrating that worldwide temps vary widely and that there were much “hotter” years even in the past 20 to 30 years, than 2023. See this.
Since 2020, with the onset of the infamous UN Agenda 2030, the news and fake news about the heat, the man-made CO2-provoked “climate-change” reaches new heights. To press that point, forest fires are not just made by paid arsonists, but by military grade Directed Energy Weapons (DEW) and other means of Environmental Modifications (ENMOD) technologies.
It is called geoengineering – and what we are witnessing today, in the last three years and even way before, is an outright war with highly sophisticated weaponized laser-directed electromagnetic energy. The energy is so strong, it blows up entire buildings on impact, with towers of flames, but it spares trees, blows up and burns cars, but not tires – and also boats on the sea, far from burning forests.
This is how the beautiful Hawaiian island, Maui, and her major city Lahaina was destroyed. For more on this – see further down.
Directed Energy Weapons are defined as electromagnetic systems capable of converting chemical or electrical energy to radiated energy, then these energies are fired by laser beams with the speed of light on specific targets. DEWs can produce forces that range from deterrent, to damaging, to destructive.
In parallel with these horrendous heat waves come typhoons, hurricanes and tsunami-like floodings around the world, especially but not exclusively, in the northern hemisphere. Most of them are also the result of geoengineering. Scandinavia was hit by deluge-like rains, causing floods throughout Norway and Denmark.
Extreme floodings were also experienced in Japan and northeastern China. Beijing registered almost simultaneously record heat waves, closely followed by extreme typhoon-caused torrential rains and consequential flooding. Natural? You bet.


