by Peter Schiff, Schiff Gold:

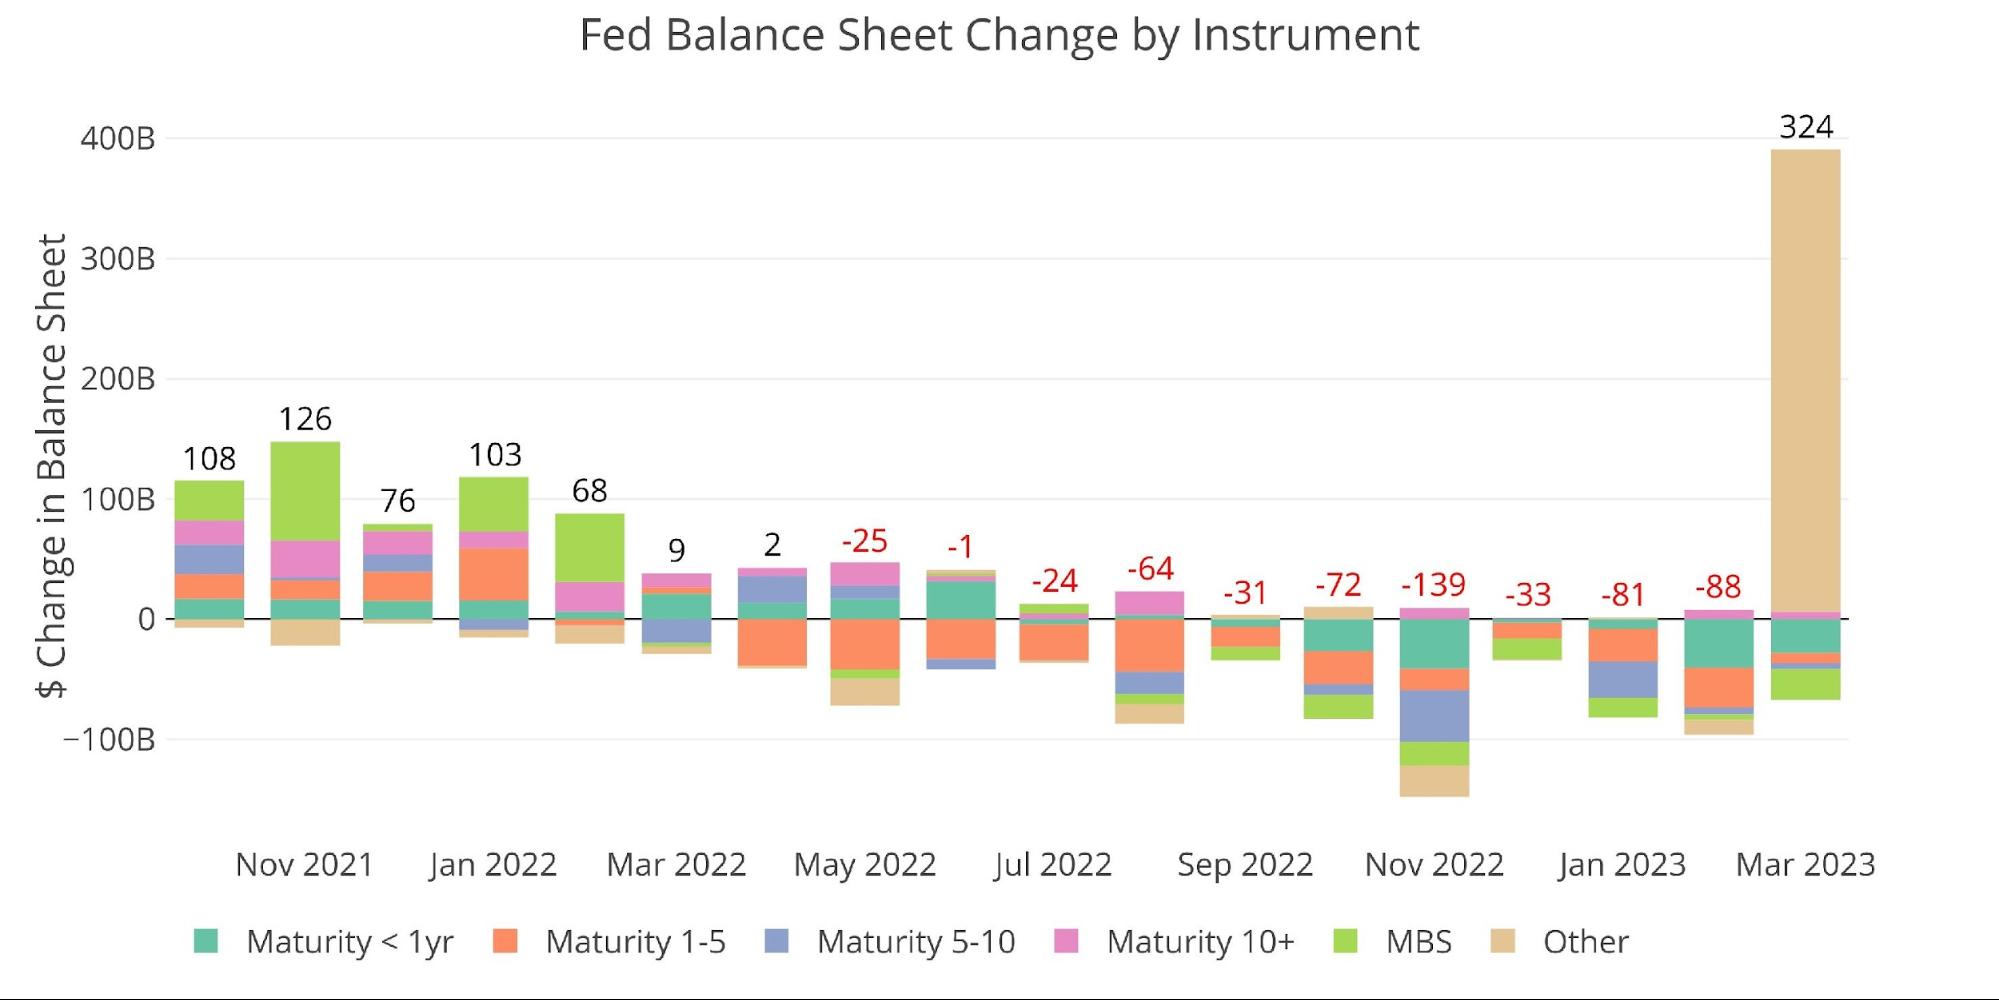
By now it should be common knowledge that the Fed has blown up its balance sheet rather quickly to combat the current banking crisis. As the chart below illustrates, the Fed added a gargantuan sum to its balance sheet in March, netting an increase of $324B.
TRUTH LIVES on at https://sgtreport.tv/
Figure: 1 Monthly Change by Instrument
It is important to understand what is driving the increase. The chart above buckets the increase in “Other”. A closer look at the balance sheet shows that the increase was driven by two main components under “Loans”:
-
- Primary Credit is a lending program available to depository institutions that are in generally sound financial condition.
-
- Current amount: $88B
-
- Other Credit Extension which is the value of loans made by Federal Reserve Banks that are not categorized elsewhere on [the Feds] balance sheet.
-
- Current Amount: $180B
-
- Primary Credit is a lending program available to depository institutions that are in generally sound financial condition.
So, yes, as the Fed defines it, the balance sheet increase in March was not QE because it did not buy Treasuries. Ideally, these two different tools are short-term in nature. In fact, Primary Credit fell by $22B over the latest week. Still, though, this is not not QE and it certainly is not QT.
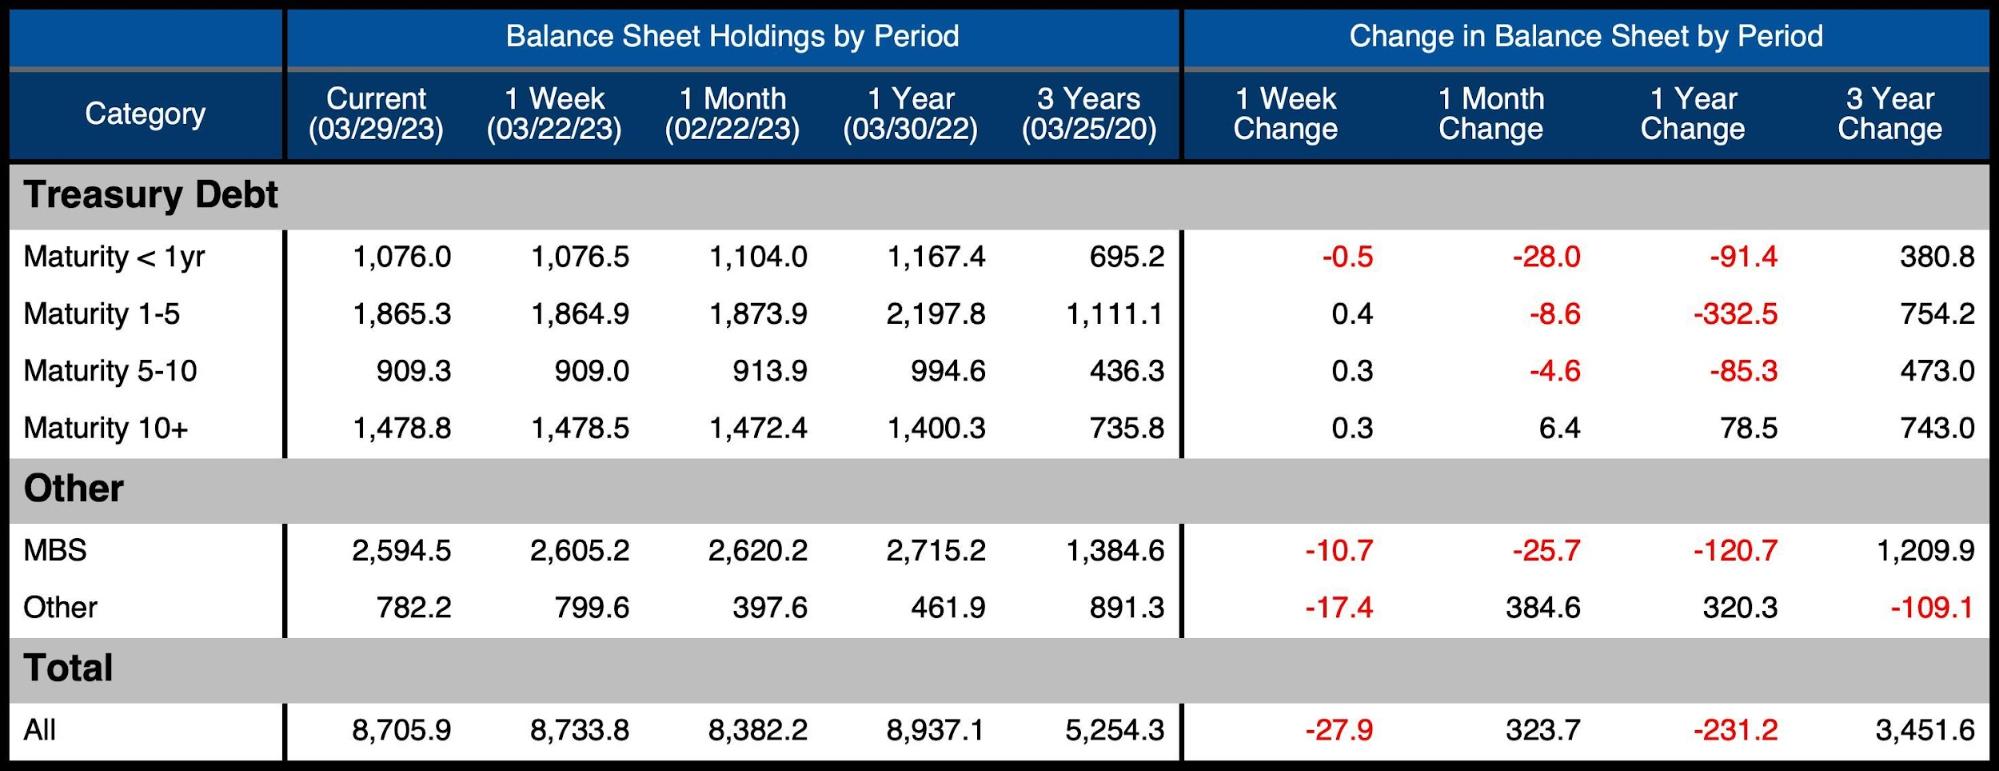
Speaking of QT, the Fed is still failing to reach its targets. The table below details the movement for the month:
- MBS were reduced by $25B, still short of the $32.5B target. This keeps the Fed’s streak alive of never hitting their actual MBS target
- Treasuries also saw a reduction, but only by $34.8B. This is about half the target amount
-
- The fall was primarily focused on the shortest end of the curve with Treasuries maturing in less than a year. It should be noted these are by far the most liquid and the easiest to sell.
-
Figure: 2 Balance Sheet Breakdown
The weekly activity can be seen below, where the latest week makes it look as though the crisis has passed. It’s more likely this is just the eye of the storm though. There are plenty of other weak banks that could come under pressure. The corporate real estate market could also be the next trigger for the next escalation of this crisis. When something does break next, expect another dramatic increase in the balance sheet.
Figure: 3 Fed Balance Sheet Weekly Changes
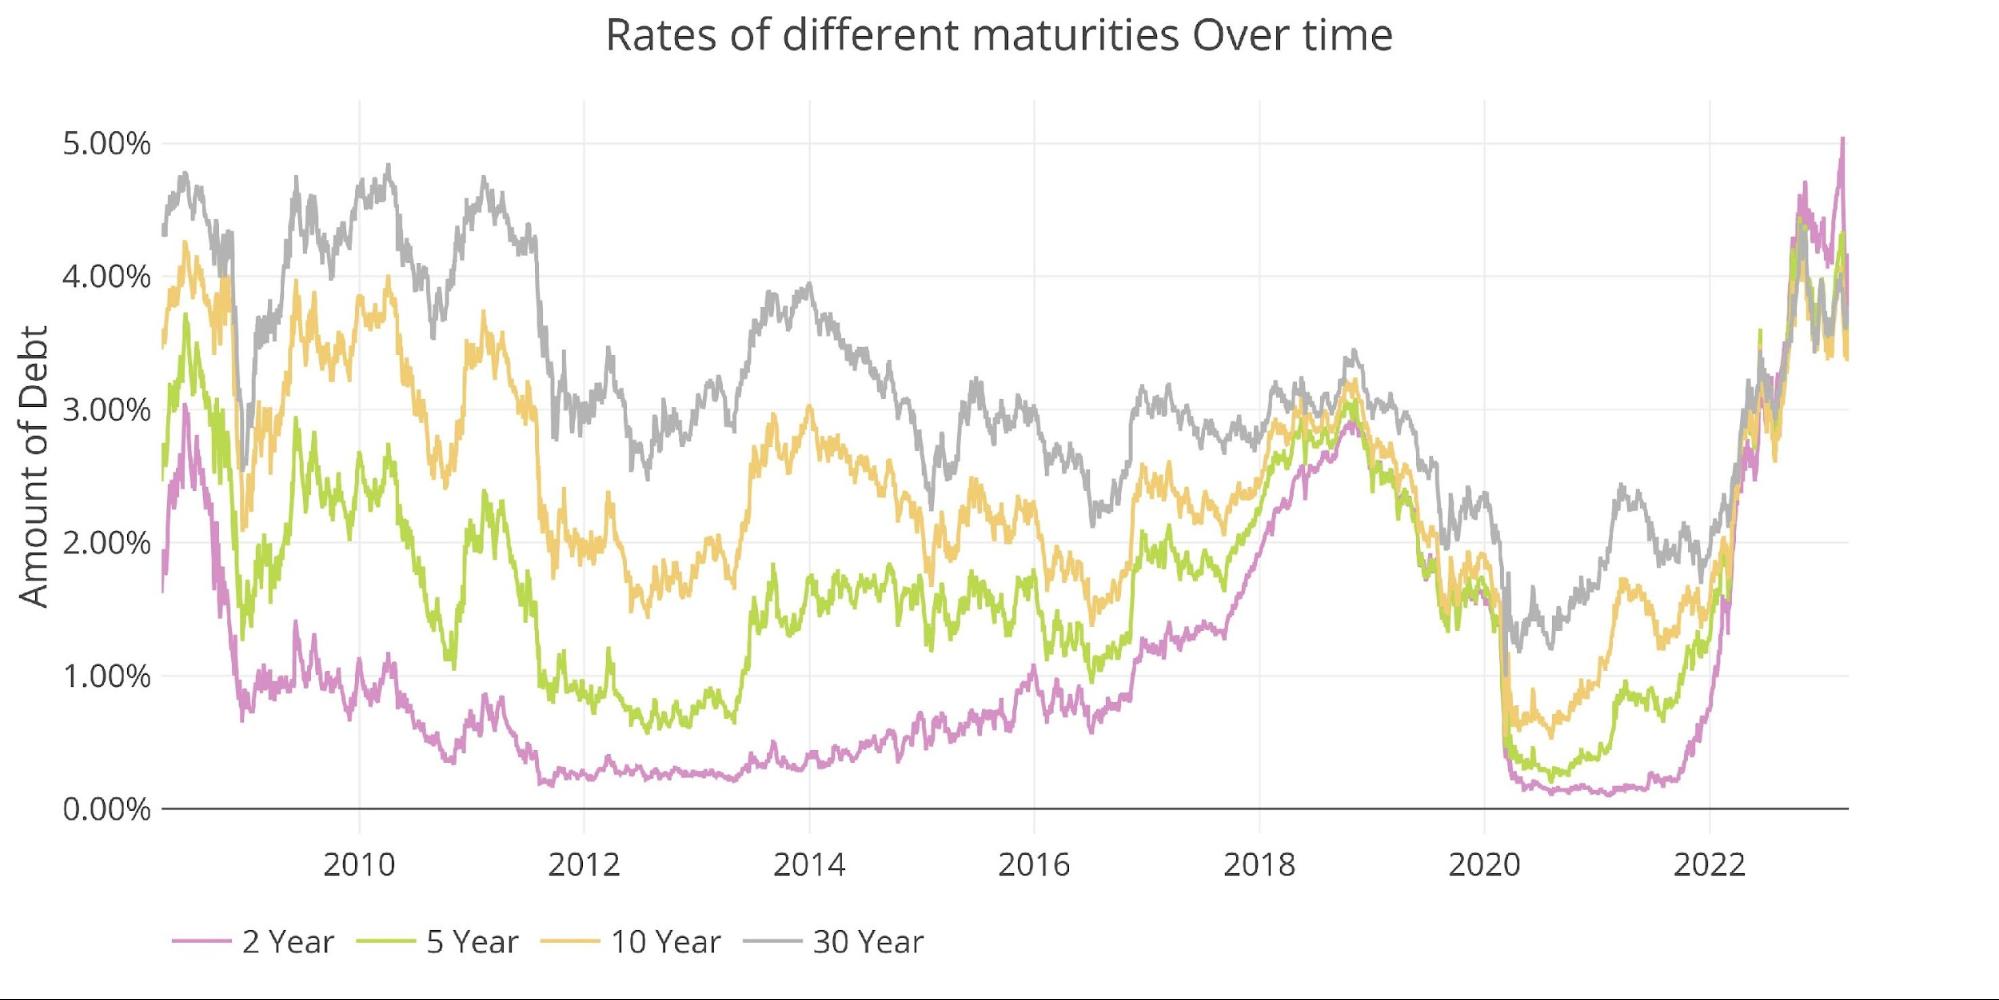
To figure out what is causing all this turmoil, look no further than the bond market. The spike in interest rates is a massive deviation from history and has exposed the cracks in a market built on cheap/easy money.
Figure: 4 Interest Rates Across Maturities
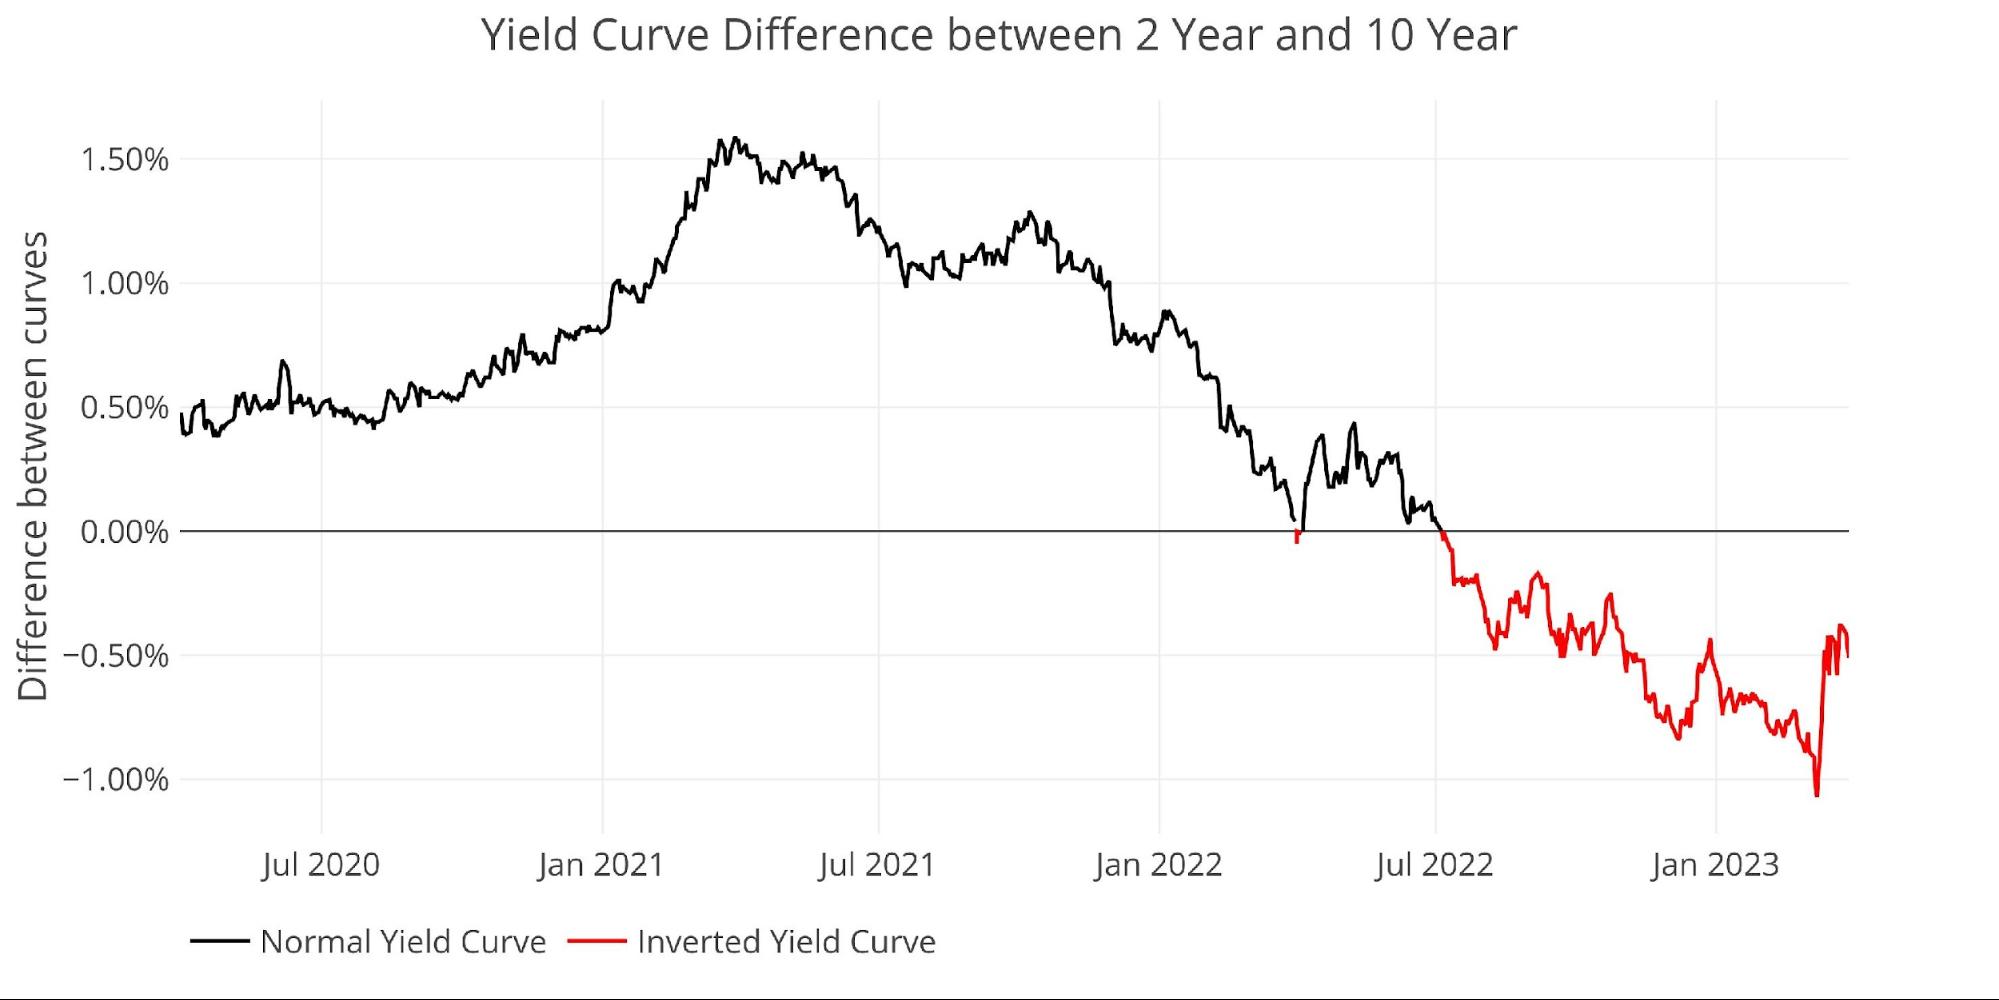
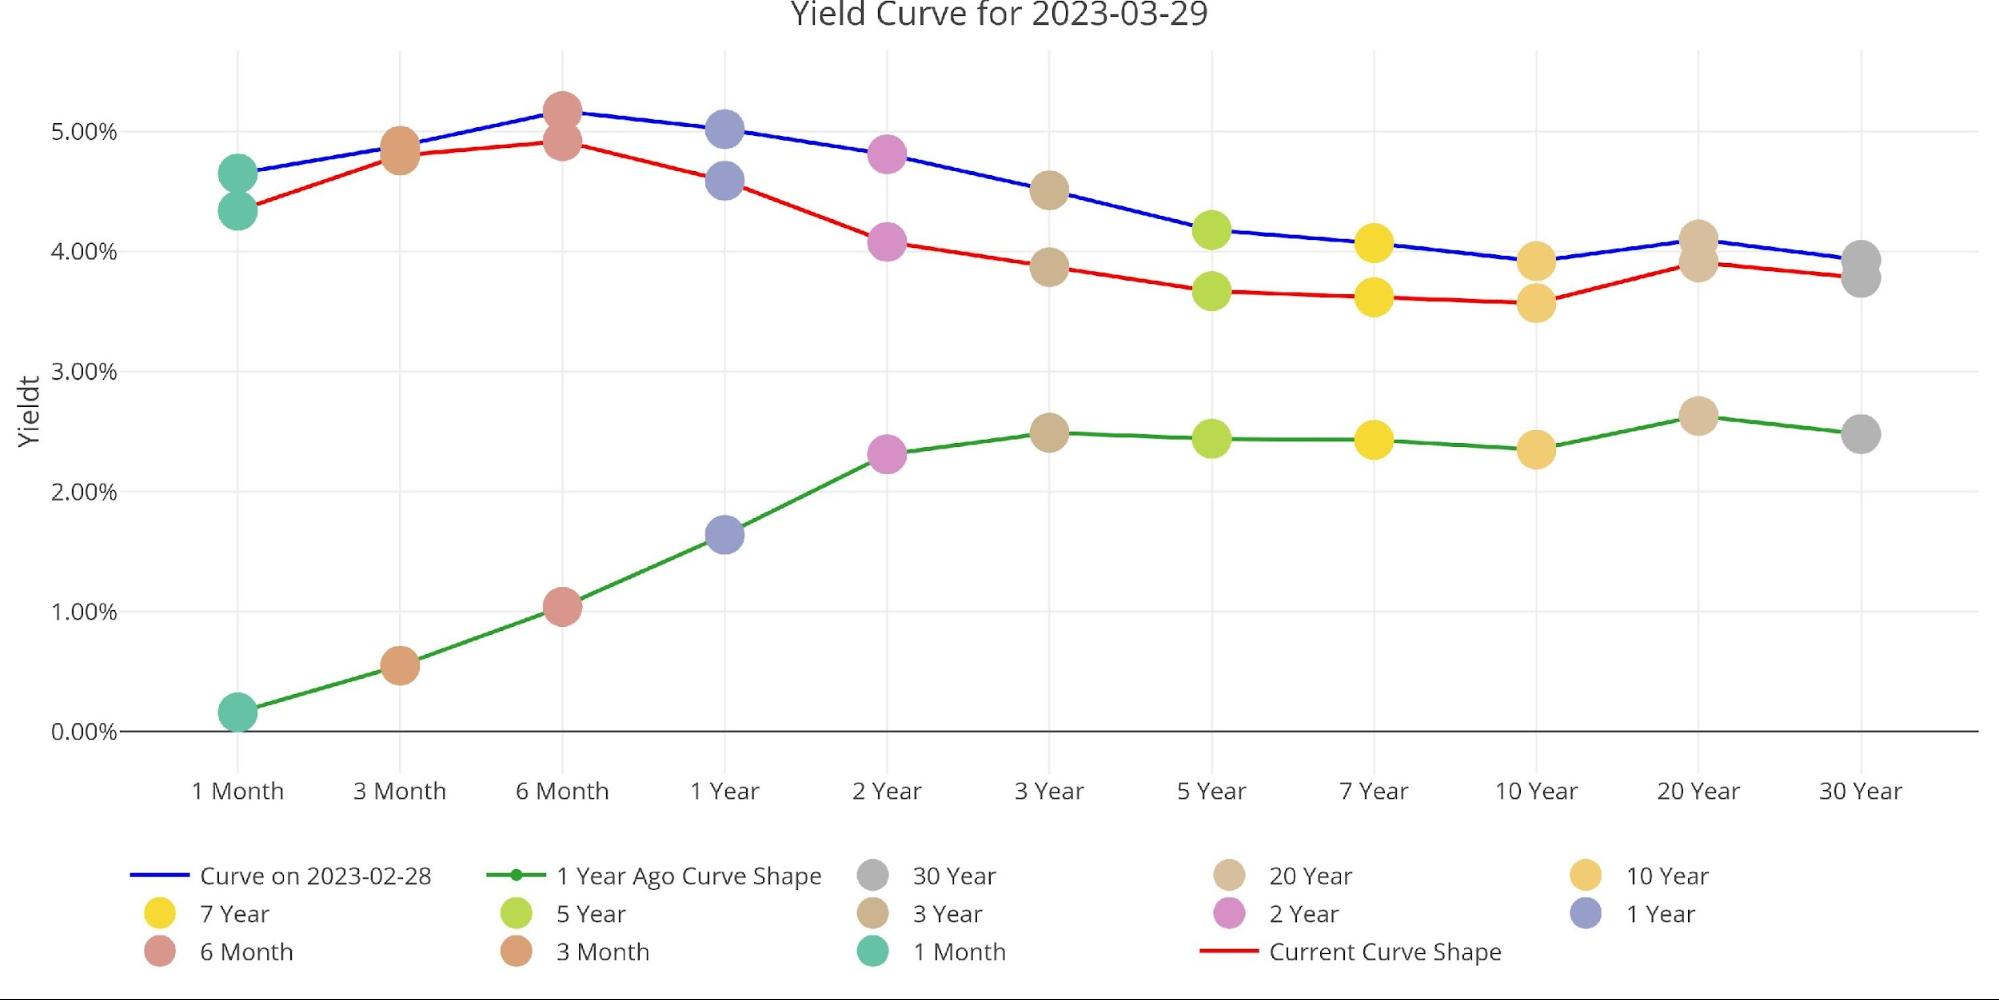
The yield curve is still inverted but has actually started to steepen some. The inverted yield curve is the clearest sign a recession is imminent, but the current steepening suggests that this crisis might look very different than 2008. Market participants could finally be pricing in the very real possibility of major stagflation.
Figure: 5 Tracking Yield Curve Inversion
The chart below shows how the yield curve has moved down slightly in the last month. The curve has dramatically changed from where it was one year ago.
Figure: 6 Tracking Yield Curve Inversion
The Fed Takes Losses
The Fed has recently accumulated about $44B in total losses. This is driven by two factors:
-
- Similar to SVB, it is selling assets (under QT) that are now worth less than when it bought them
- The interest paid out to banks (4%+) is greater than the interest it receives from its balance sheet (2%)
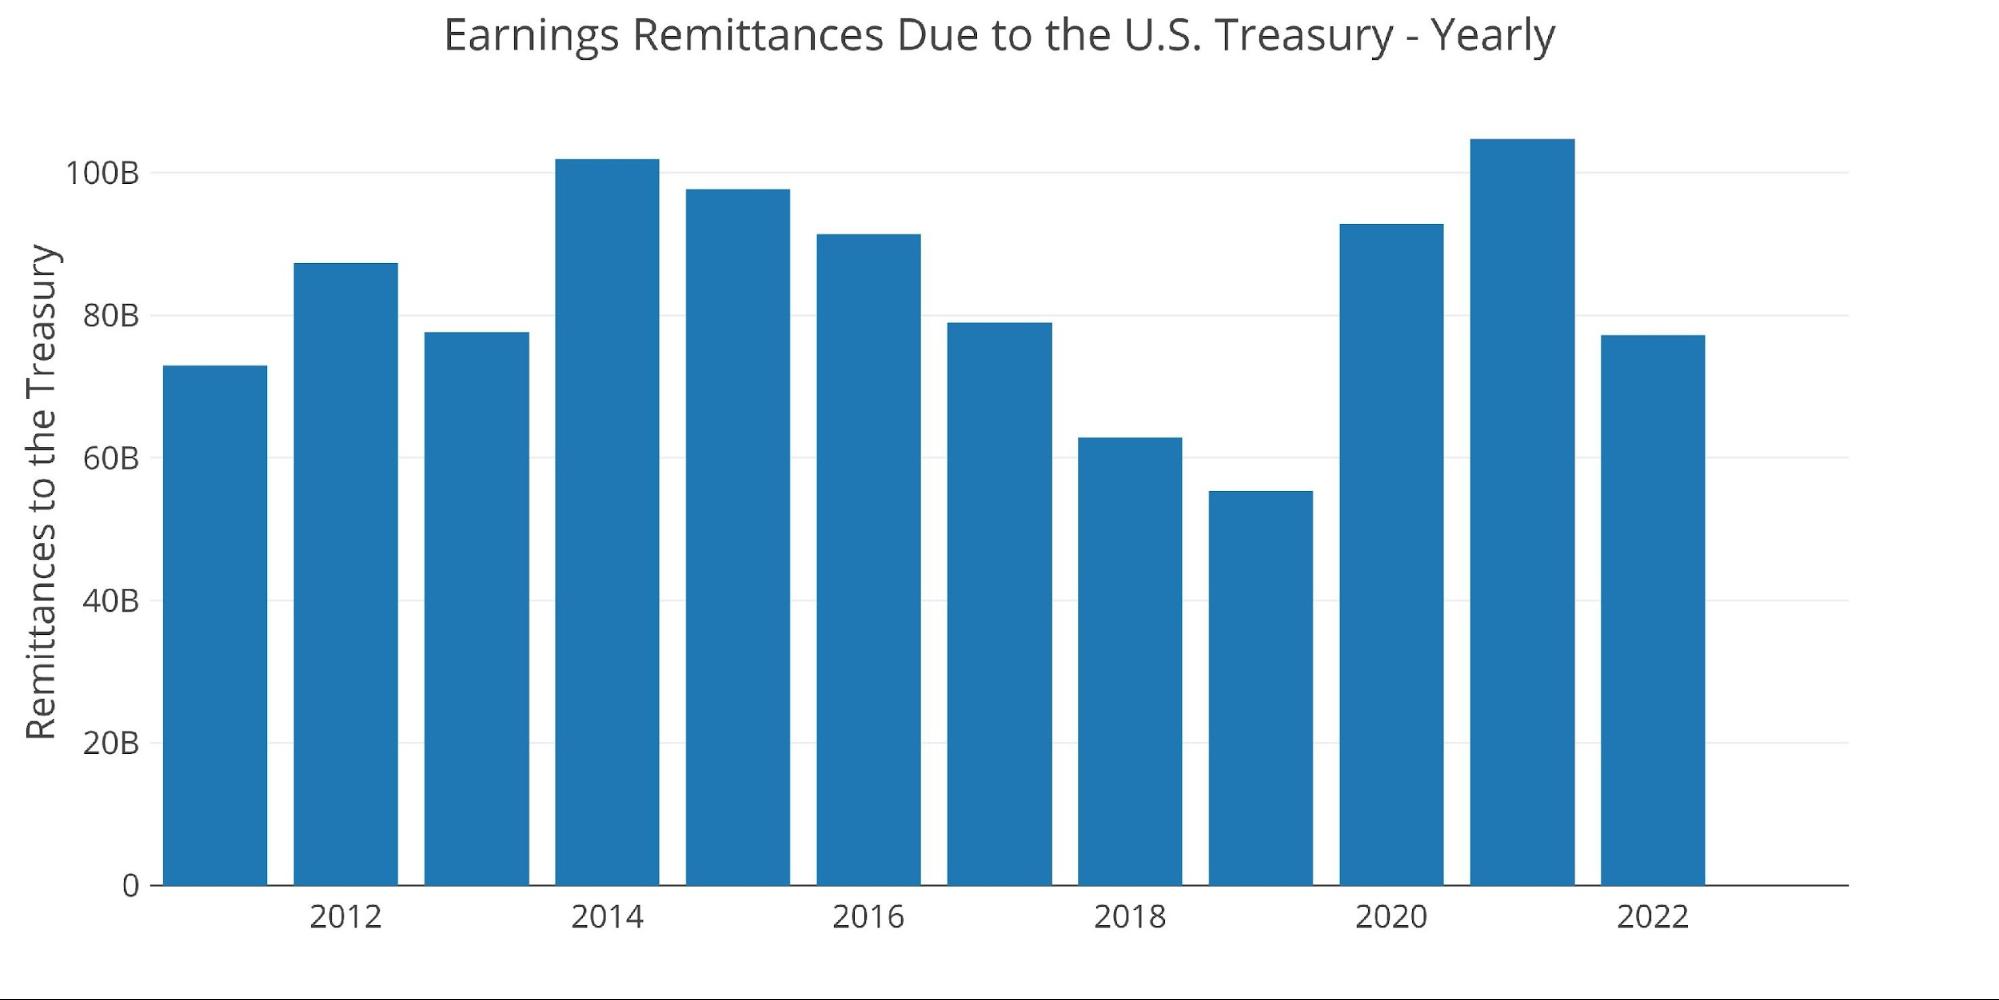
When the Fed makes money, it sends it back to the Treasury. This has netted the Treasury close to $100B a year. This can be seen below.
Figure: 7 Fed Payments to Treasury
You may notice in the chart above that 2023 is showing $0. That’s because the Fed is losing money this year. According to the Fed: The Federal Reserve Banks remit residual net earnings to the U.S. Treasury after providing for the costs of operations… Positive amounts represent the estimated weekly remittances due to U.S. Treasury. Negative amounts represent the cumulative deferred asset position … deferred asset is the amount of net earnings that the Federal Reserve Banks need to realize before remittances to the U.S. Treasury resume.


