by Kelsey Williams, Silver Seek:

Silver fever is rising. Calls for $100 silver (see $100 Silver Has Come And Gone) and higher echo loudly. With its price close to $25 oz. after being as low as $18 oz. last fall, now would be a good time to review how well silver has responded to past predictions of impending higher prices.
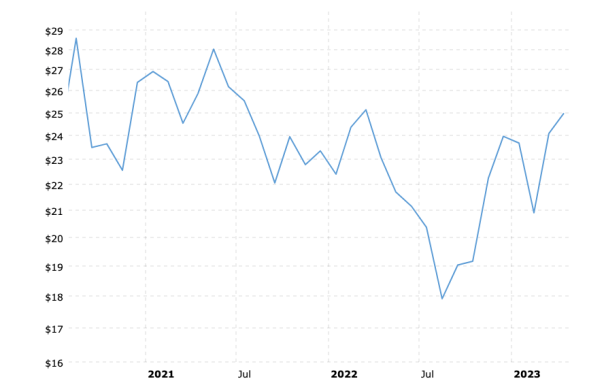
Below is our first chart (source). It shows a recent three-year history of the silver price using monthly average closing prices…
TRUTH LIVES on at https://sgtreport.tv/
CHART NO. 1
Silver Prices – 3 Year Historical Chart

As can be seen in the chart above, the silver price has risen almost forty percent since last August. As impressive as that is, it is also clear that the silver price has not as yet exceeded its peak from one year ago, and is lower than its peaks from May 2021 or August 2020.
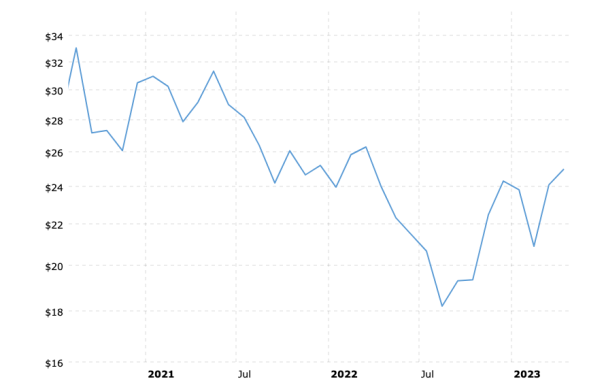
See Chart No. 2 below which has the same silver price history except that the prices have been adjusted for inflation…
CHART NO. 2.
Silver Prices (inflation-adjusted) 3-Year Historical Chart

What Chart No. 2 shows us is that when measuring for the effects of inflation, the price of silver is lower still than each of its previous peaks from 2022, 2021, and 2020. The downtrend dating back to the summer of 2020 is well-defined.
Here is Chart No. 3 which dates back further, to the silver price peak in August 2011…
CHART NO. 3
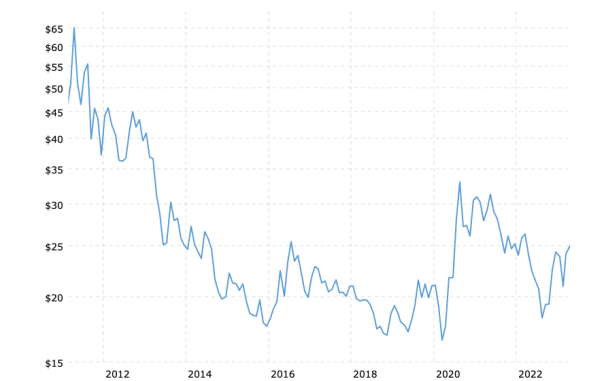
Silver Prices (inflation-adjusted) 12-year Historical Chart

In Chart No. 3 we see that silver is well below its price peak from twelve years ago. The silver price peaked at almost $49 oz. then. That peak is now the equivalent of $65 oz. in today’s cheaper dollars.
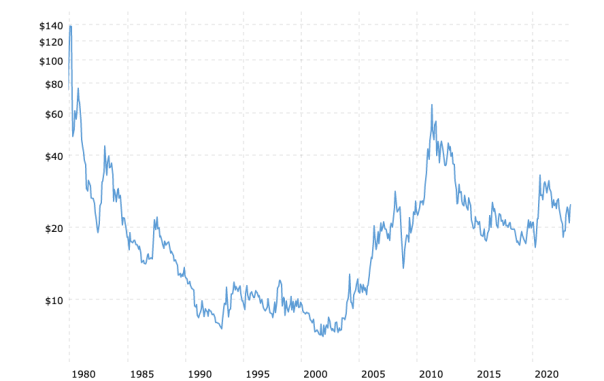
Our fourth and final chart shows a silver price history dating back to January 1980. The average closing price for silver then was $36 oz…
CHART NO. 4
Silver Prices (inflation-adjusted) 43-year Historical Chart

In Chart No. 4, we see the startling effect of inflation on the silver price over the long term. In today’s cheaper dollars, silver needs to exceed $140 oz. just to match the January 1980 average closing price of $36 oz.
More often, though, we hear about silver’s intraday high of $49 oz. in January 1980. For silver to match that high in today’s cheaper dollars it would need to exceed $180 oz.
SILVER FACTS FOR BARGAIN HUNTERS
- Silver is in a multi-decade downtrend dating back to 1980.
- The silver price needs to be $184 today to match its 1980 intraday high of $49.
- Silver at $25 oz. today is the equivalent of $8 oz. in March 1980.
- Silver is definitely cheap; historically speaking, it always is.
If you are expecting the latest pop in the silver price to continue, look for a place to take some quick profits. If you managed to buy silver last fall and have some nice short-term profits, take them.
There is nothing historically to support claims for the silver price to reverse its long-term downtrend or exceed its previous peaks. It can’t even do that on a nominal price basis.


