by Craig Hemke, Sprott Money:

By now, you likely know that an inverted yield curve is almost always a precursor of economic contraction and recession. But can the yield curve tell you when the recession has actually begun? Let’s explore that today.
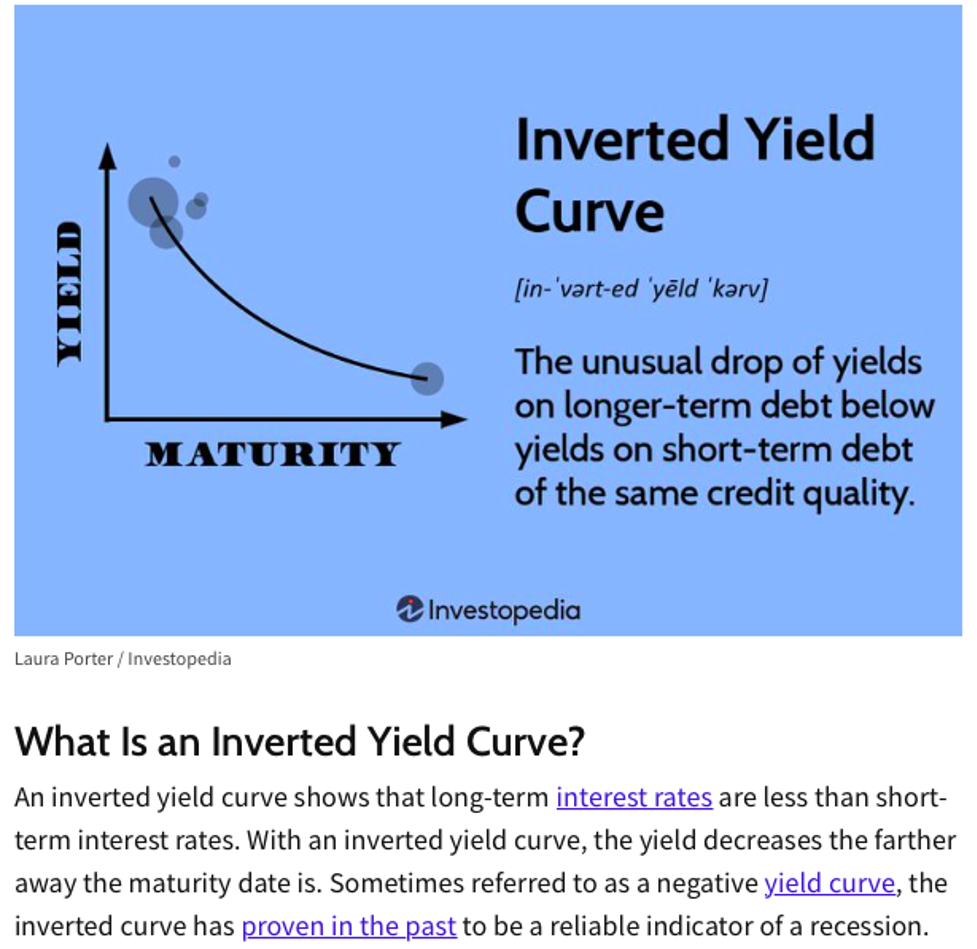
First of all, what is an “inverted yield curve”? Well, the natural slope of the yield curve is positive, meaning short-term interest rates are lower than long-term interest rates. The opposite of this appears occasionally when short-terms rates are higher than long-term rates. The result is what’s called an inverted yield curve. From Investopedia:
TRUTH LIVES on at https://sgtreport.tv/

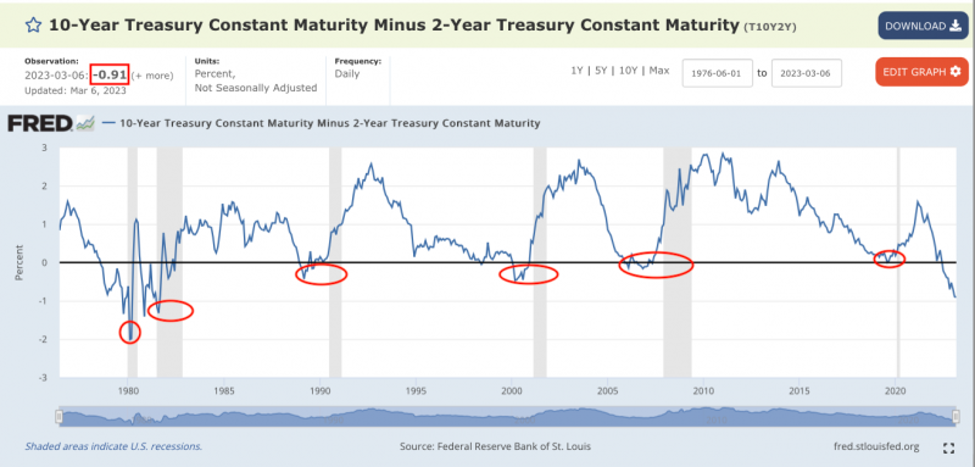
The chart below is taken from The Federal Reserve’s own research site. What you see is the spread or “curve” of the U.S. 2-year note versus the U.S. 10-year note. Over the past 40 years, this spread is almost always positive. However and as you can see, there are periods where the curve inverts and, most importantly, a recession (marked in gray) has followed each time.

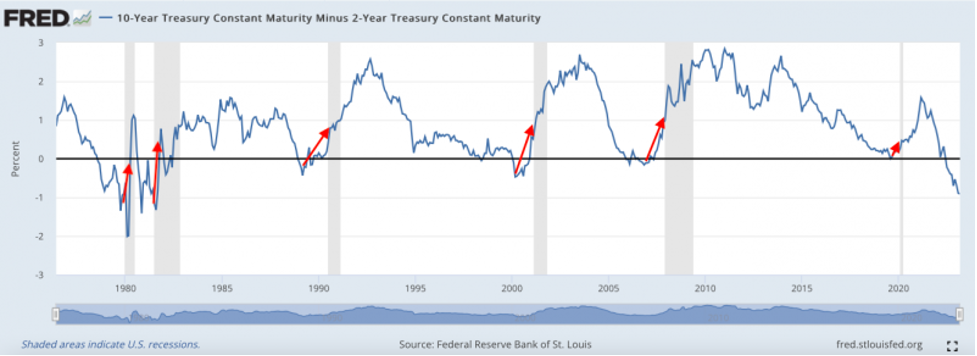
So an inverted yield curve has a perfect track record in predicting recessions. The only problem is that an inverted curve by itself does not tell you WHEN the recession will begin. For that, we have to look again at the same chart. This time, note the red arrows:

AHA! Now we’re onto something!! The chart above clearly shows that recession is imminent once the yield curves stops inverting and begins to move toward flattening. If this situation holds again in 2023…and why wouldn’t it?…then we’ll need to watch for this pattern to repeat.
So far this year, the yield curve inversion has continued to steepen. The yield on the 2-year note finished 2022 at 4.43% while the 10-year note was at 3.88%. That was an inversion of 0.55% or 55 basis points. However, as I type this on March 7, the yield on the 2-year note is currently at 4.96% and the 10-year is at 3.95%. That’s an inversion of 101 basis points and the widest, most negative this spread has been since 1981!
Clearly, the recession-signal flattening has yet to begin. It’s most definitely coming, however. Of that, you can be certain.
And what would drive a flattening of the curve? Well, that’s pretty simple:
- short rates begin to rise more slowly than long rates OR
- short rates fall while long rates hold steady OR
- short rates fall while long rates rise OR
- short rates fall faster than long rates
What’s most likely is that short rates will soon begin to fall and narrow the gap versus longer rates. What would cause short rates to fall? An end to fed funds rate hikes would do it but I suspect it will be something more “organic” and market-oriented.
For example, right now at the shortest end of the yield curve, an investor can buy a 6-month U.S. treasury bill with a yield of 5.28%. That’s only about 4.50% higher than it was last year at this time!


