by Chris Morrison, Daily Sceptic:

Up to one fifth of all warming reported across the planet by around 20,000 weather stations is invalid due to corruption from non-climatic data. This finding is the latest revelation from two atmospheric scientists seeking to measure the effect of human-caused urban heat on global surface temperature measurements. The news is sensational because it depresses further the major slowdown in warming observed since around 1998. With the global temperature warming by little more than 0.1°C over the last two decades, it makes claims of 4°C warming by the end of the century seem even more implausible.
TRUTH LIVES on at https://sgtreport.tv/
The latest finding arises from the ongoing work of Dr. Roy Spencer and Professor John Christy of the University of Alabama in Huntsville. The two scientists looked at the 19,885 temperature stations in the Global Historical Climate Network (GHCN) distributed around the world from latitudes 20N to 82.5N. They found that over the last 40 years, virtually all of them had experienced growth associated with human settlement. The global work is said to be at an early stage, but “very preliminary calculations” are said to suggest that urban heat averaged across all stations is about 10-20% of GHCN trends.
Major global temperature compilers such as the U.S.-based National Oceanic and Atmospheric Administration (NOAA) claim to remove urban heat effects by homogenisation techniques, but the scientists say this is unlikely. Abrupt changes in station data can be removed, but they cannot correct “for any sources of slowly increasing spurious warming”. In their latest work, the scientists undertake a critical investigation of NOAA’s homogenisation procedure and astonishingly conclude it is on average “spuriously warming station temperature data trends when it should be cooling them”. The detailed reasons are given in the latest note published by Spencer, where he asks why NOAA adjustments are going in the wrong way? “To say the least, I find these results …. Curious,” he says.
The GHCN forms the core of all the major global surface temperature datasets including the Met Office’s HadCRUT. In the recent past, all these datasets have been subject to considerable upwards retrospective adjustments, and these have largely removed the pauses and slowdown seen over the last two decades. This has enabled further ‘record’ high temperatures to be declared, and the continued Net Zero-helpful promotion of improbable multi-centigrade warming in the near future. Last month, NOAA claimed that the 10 warmest years on record have all occurred since 2010.
In a recently published paper, Nicola Scafetta, a climate research scientist at the University of Naples, noted that the Met Office HadCRUT database had recorded warming of 0.03°C per decade during the hiatus years of 2000-2014. In 2013, Scafetta noted that HadCRUT version 4 increased the warming to 0.08°C per decade. HadCRUT5 further adjusted the 2000-14 figure to supply warming of 0.14°C per decade. A period of pause – a pause that the Met Office actually wrote about – was converted to strong warming. Needless to say, accurate satellite temperature data shows the first pause, along with a current one that is over eight years long.
In their ground-breaking work, Spencer and Christy use a satellite dataset of urbanisation called ‘Built Up’ to determine the average effect that urbanisation has had on surface temperatures. Urbanisation differences were compared to temperature changes from closely-spaced weather stations. Earlier findings suggested that in the last 50 years, there was a remarkable 50% less warming across the eastern United States. Again the work is preliminary and the scientists suggest it is likely to be at the upper limit of de-urbanisation adjustments. Nevertheless, there were many surprises, not least in data from airports. These places contribute many readings to global datasets, but massive distortions were found. One of the worst examples was Orlando International Airport where the warming was measured at 0.3°C per decade. This fell to a de-urbanised figure of just 0.07°C.
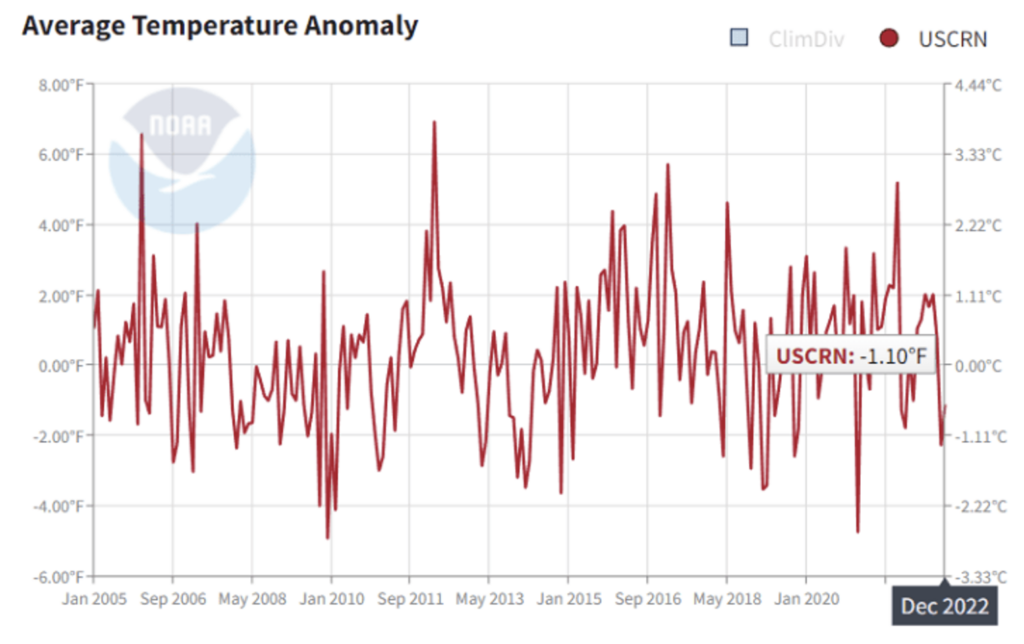
In fact, NOAA does make a serious attempt to track U.S. temperatures away from any urban or human corruptions. A rarely-publicised database is compiled from 114 nationwide stations designed to provide continuous recordings well away from any urban heat distortions. The measurements started in 2005, and to date show little if any warming. It is called the US Climate Refence Network, and the latest graph is posted below.

Intriguingly, the scientists are finding that the strongest urban heating occurs at near-rural sites. Others have noted that the urban heat effect is strongly non-linear with, for example, a 2% increase in urbanisation at rural sites producing much more warming than a similar rise at an urban site. “This means that a climate monitoring dataset using mostly rural stations is not immune from spurious warming from creeping urbanisation, unless there has been absolutely zero growth,” they commented.


