

by Wolf Richter, Wolf Street:
![]() Looks like households have lots of fuel left to throw on inflation, if they’re in the mood.
Looks like households have lots of fuel left to throw on inflation, if they’re in the mood.
What is the burden on households from servicing their debts and other financial obligations, in terms of their disposable income? That’s perhaps the most important debt measure, and the question we’re going to grapple with in a moment.
TRUTH LIVES on at https://sgtreport.tv/
The pandemic-era policies left households flush with money, allowed them to catch up with past-dues, and allowed them to move delinquent debt into forbearance. They had free money by not having to make payments on mortgages, student loans, and rent. Then there were the PPP loans, over $800 billion of them. Delinquency rates, foreclosure rates, third-party collections, and bankruptcies all dropped to record lows. As a result, credit scores improved across the board. This was topped off by the blistering asset price inflation in stocks, bonds, real estate, cryptos, etc. But all of this is now getting more or less rapidly unwound.
Auto loan delinquencies in Q3 rose for the third quarter in a row, but are still lower than any time before the pandemic. Consumer bankruptcies remain near record lows in Q3; foreclosures, after ticking up for two quarters, fell again in Q3; and the number of consumers with third-party collections fell to a record low in Q3 (I discussed this in detail here).
Credit cards are being used as a universal payment method, and credit card “debt” includes balances that get paid off every month and never accrue interest. So credit card balances are more of a measure of transactions than of debt. And despite the surge in spending on travels this year, nearly all of which is purchased via credit cards, balances only went back to where they’d been three years ago (which I discussed in detail here).
So how much of a burden is this debt for households?
First a caveat. We’ll get into ratios in a moment. These are estimates by the Federal Reserve based on all kinds of aggregate data. The absolute ratios are not important, and whether or not they’re “realistic” or whatever for a particular household is not important either.
What is important is how the ratios move over time, whether they rise or fall, and where the breaking points were at which households started to buckle under their debts – for example during the employment crisis and mortgage crisis that accompanied the Financial Crisis.
The household Financial Obligation Ratio (FOR) tracks total financial obligations as a percent of disposable income. These financial obligations are the broadest measure of burden and include not only payments on mortgages, credit cards, auto loans and leases, etc., but also rent payments, homeowners’ insurance, and property tax payments.
For revolving debt, such as credit cards, the Fed uses an estimate of the required minimum payments, rather than total balances because borrowers are only obligated to make that minimum payment.
The ratio of these financial obligations ticked up to 14.5% of disposable income in Q3, according to the Federal Reserve’s data released today. Disposable income is income from all sources minus payroll deductions.
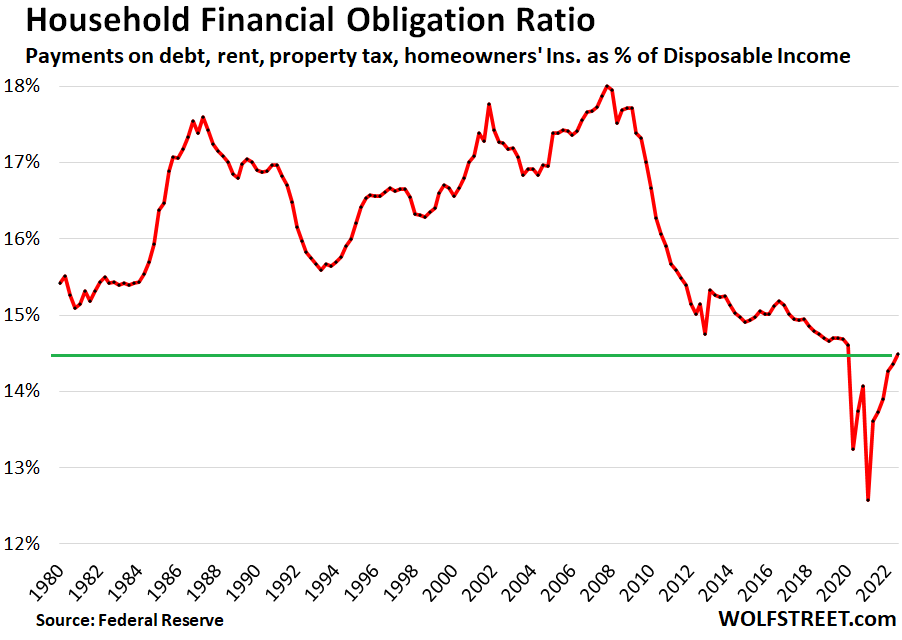
During peak stimulus in Q1 2021, the Financial Obligation Ratio dropped to a record low of 12.6%. On the eve of the Financial Crisis, in Q3 2007, it hit 18%. Today’s reading, while up from the pandemic lows, is still below any pre-pandemic lows.
In other words, households are far less burdened by financial obligations, in terms of their income, than at any time going back to 1980, and are therefore less likely to get into the kind of trouble they got into during the Financial Crisis, as long as jobs are holding up.
Jobs... If there is an unemployment crisis, as there was during the Financial Crisis, the disposable income of millions of people plunges to the level of unemployment benefits, and the burden of debt payments becomes insurmountable for many households. But this is still the weirdest job market ever, and a very hot job market, with surging pay, where laid-off workers are still quickly absorbed by other employers. And so far, so good.
The household Debt Service Ratio (DSR) is narrower than the FOR and only tracks payments on mortgages and consumer loans (payments on auto loans and minimum required payments on revolving credit, such as credit cards and personal loans) as a percent of disposable income.
 Witness CONFIRMS families of politicians are financially benefiting from leasing buildings to the Federal Government